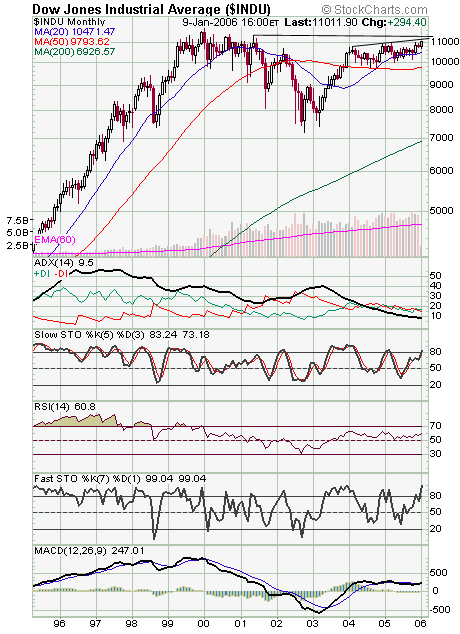
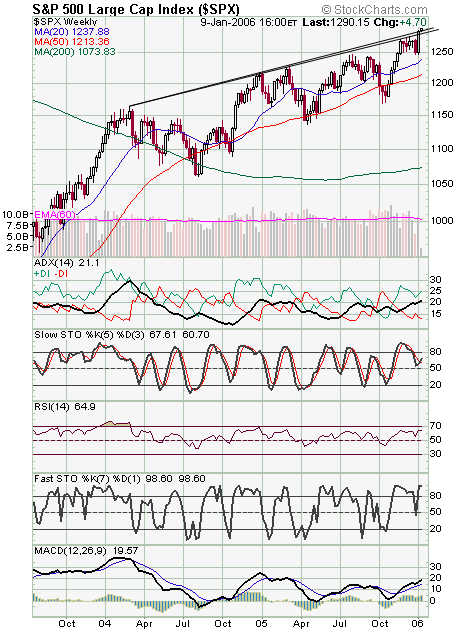
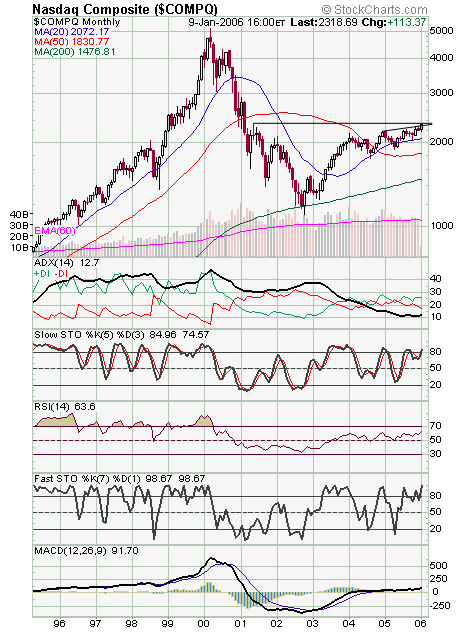
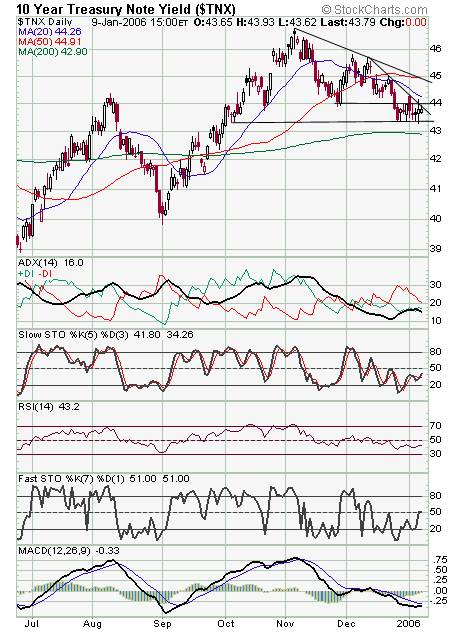
The indexes continue to chew through big resistance levels in this impressive start to the new year. The Dow (first chart below) finally cleared the 11,000 barrier today, albeit weakly, and the S&P (second chart) has now taken out all of its two-year trendline resistance. The question now is how much higher can momentum move the market before the inevitable correction? The S&P and Nasdaq (third chart) could hold the answer, with both indexes coming up on their May 2001 highs of 1316 and 2328, respectively. How they handle those levels, and the Nasdaq’s test will likely come first, could dictate how long this rally can last. The Dow doesn’t appear to have another major test coming until 11,150-11,200 and 11,350. For support, 10,940-10,950 on the Dow and 1280-1285 on the S&P are the most important levels here. Long bonds (fourth chart) continue to hold up well; no problem for the bulls there yet.