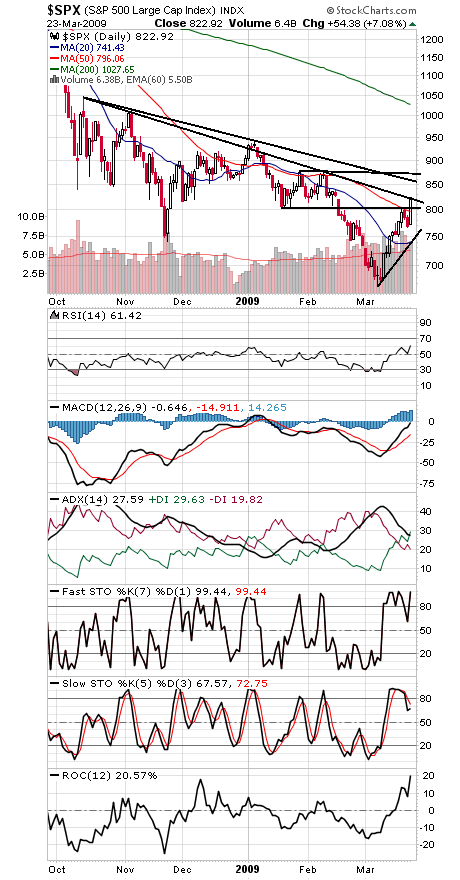
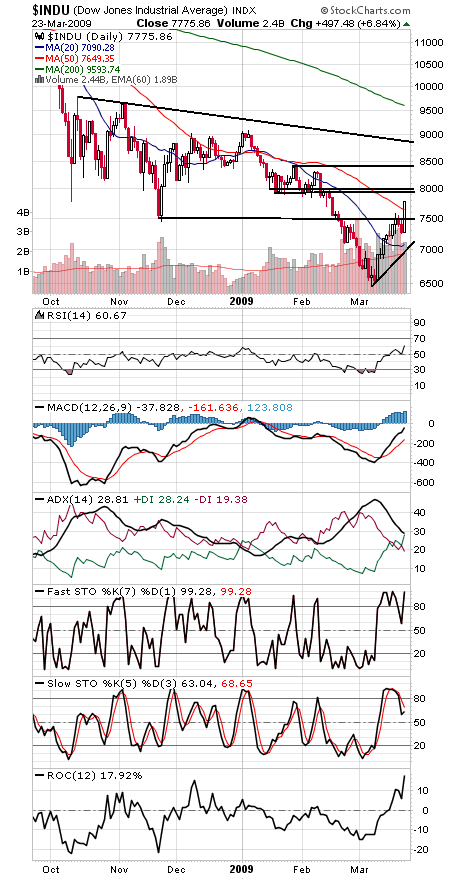
A big breakthrough for the stock market today, as the Dow and S&P both moved solidly back above their 2002 lows (see Rally Hits a Big Level).
Those levels — 7200-7500 on the Dow and 768-789 on the S&P — are now critical support for the market, with 796-803 on the S&P and 7650-7571 on the Dow the first support levels (see first two charts below).
To the upside, any move higher on the S&P could set up a test of 855 and 878, while the Dow faces a big hurdle at 7900-8000.
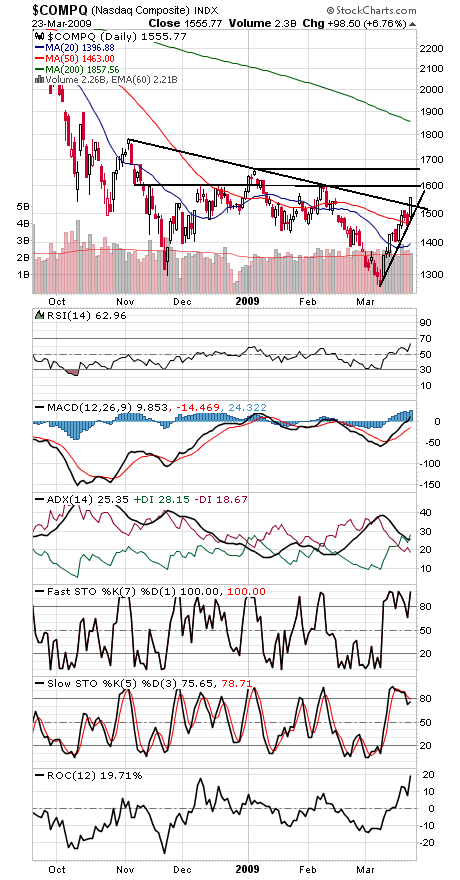
The Nasdaq (third chart) faces resistance at 1600 and 1665, and support is 1540, 1505 and then 1463.
While sentiment didn’t hit bearish extremes on this last leg down, momentum on the rally has nonetheless been strong. One indicator to note is a higher low and higher high in rate of change (ROC) on the index charts below, another sign that, at least for now, the bulls have control.
Paul Shread is a Chartered Market Technician (CMT) and member of the Market Technicians Association. He is a co-author of an upcoming book on Dow Theory from W&A Publishing.