Today’s sharp downturn raises the odds of a retest of the lows; we’ll be watching to make sure that internals like new lows and declining issues don’t expand too much in the process.
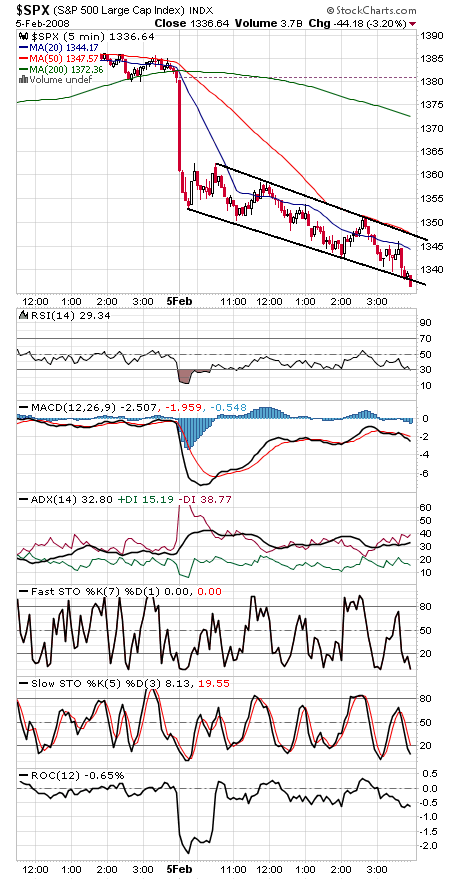
Looking at the intraday chart on the S&P 500 (first chart below), we see a sharp drop at the open followed by a grind lower the rest of the day. This is potentially bullish action, since it suggests the possibility of an overreaction to the day’s news — but the S&P needs to clear that downtrend line at 1347 and falling to confirm that possibility.
On the other hand, if the market continues lower from here, the decline could accelerate since we’re already below the lower trendline of that pattern, so tomorrow’s action could be important.
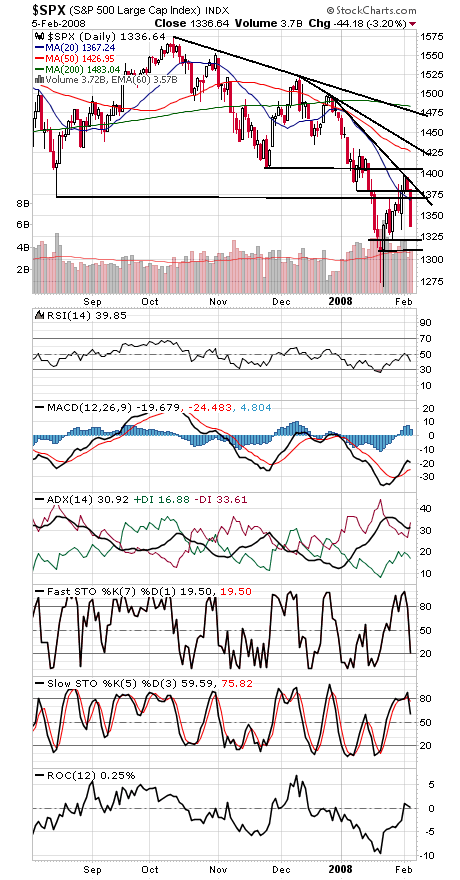
To the upside, 1370-1380 is once again resistance (second chart), and next supports are 1322, 1310, 1300 and 1270-1275.
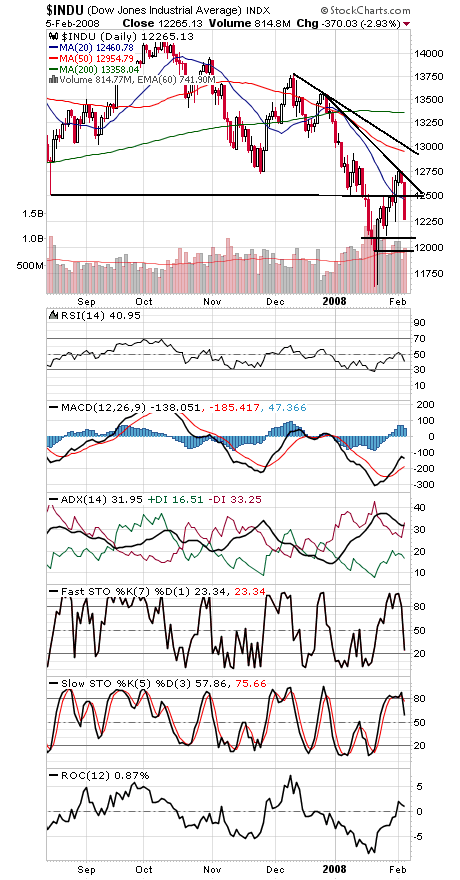
The Dow (third chart) has support at 12,092 and 11,975-12,000, and 12,500 is once again resistance.
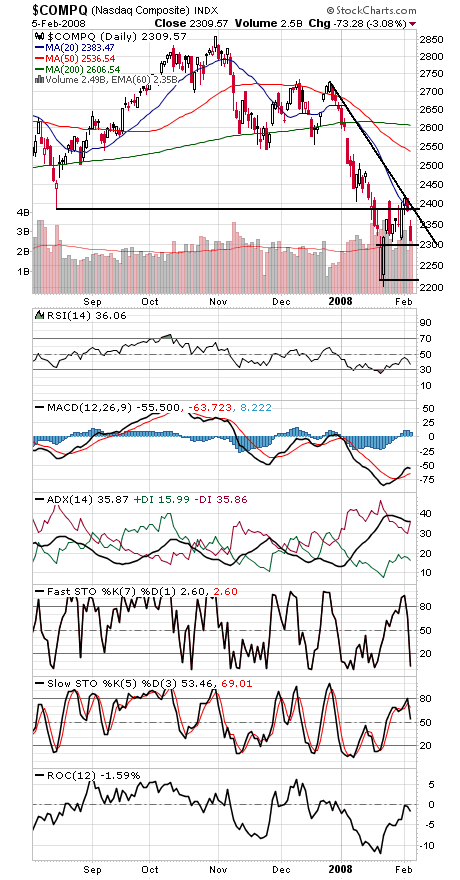
The Nasdaq (fourth chart) has support at 2300, 2250 and 2200-2220, and 2387-2400 is once again resistance.
Paul Shread is a Chartered Market Technician (CMT) and member of the Market Technicians Association.


