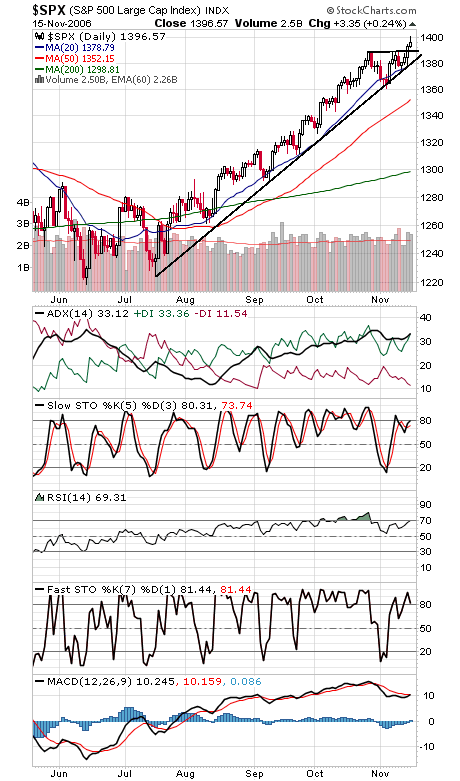
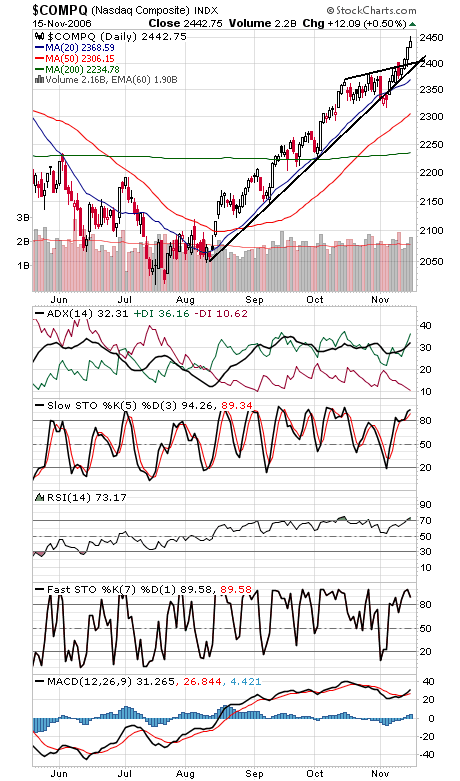
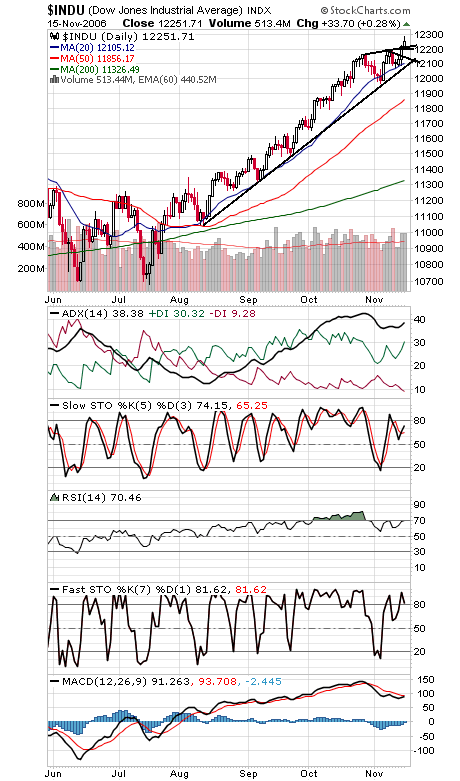
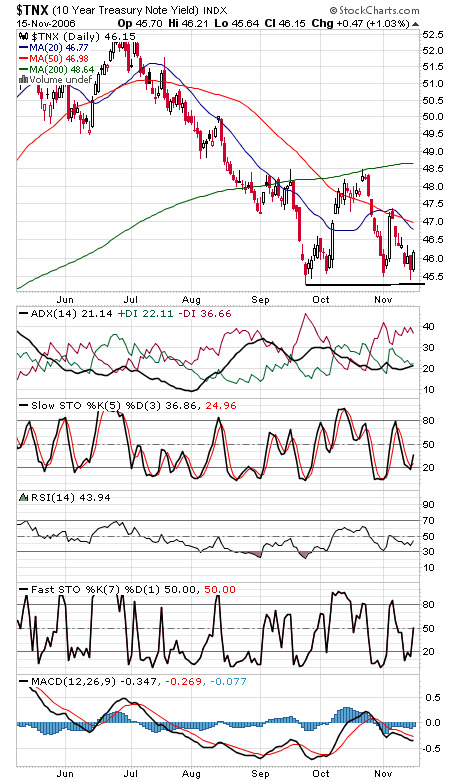
Someone finally woke up and realized there’s a rally going on. The Investors Intelligence survey of investment advisors showed a big spike in bulls to 56.4% this week, and a big drop in bears to 22.3%, a four-point move in each. Since tops the last few years have typically occurred around the 60-20 area, that’s one data point to keep an eye on, in addition to commercial traders shorting the S&P futures. Still, we haven’t seen much excess in call buying or TICK readings, so the market shouldn’t be in too much trouble just yet. The S&P (first chart below) stalled out just above 1400 today, with 1414-1426 the next big resistance zone above that. First support is 1395, with 1389 and 1382 below that. The Nasdaq (second chart) faces resistance at 2450-2452, and support is 2425-2430, with 2395-2400 below that. The Dow (third chart) has support at 12,200, with 12,130 and 12,100 below that. We should also note the number of -DI readings at or below 10 on those charts, which means no one wants to sell here; that could be a recipe for a pullback. Bond yields (fourth chart) didn’t seem to like the Fed’s tough talk today, but consumer inflation data in the morning could change that picture.


