Note: The Technical Analysis column will return on Thursday.
One of the oldest and most consistent advantages for traders — the first-of-the-month rally phenomenon — continues to pay dividends. Pioneered by the likes of Norm Fosback, who tested it back to 1927 in his 1975 book “Stock Market Logic,” the system has performed well both in back testing and practice (“in and out of sample”), making it a pretty sound trading system. Fosback’s own implementation of it has matched the market’s performance over time with much less exposure. The market’s cycle remains positive through this week, but starting next week, the bulls are going to have to show some resolve if they’re going to propel the market out of its funk and through the S&P’s all-time high of 1527.46-1552.87.
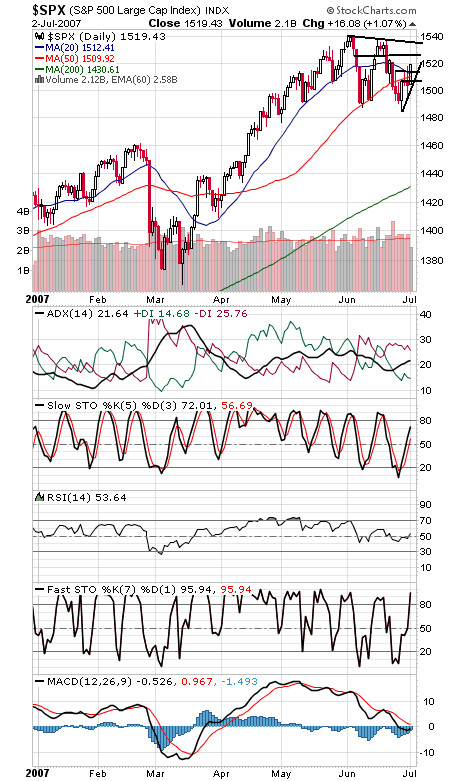
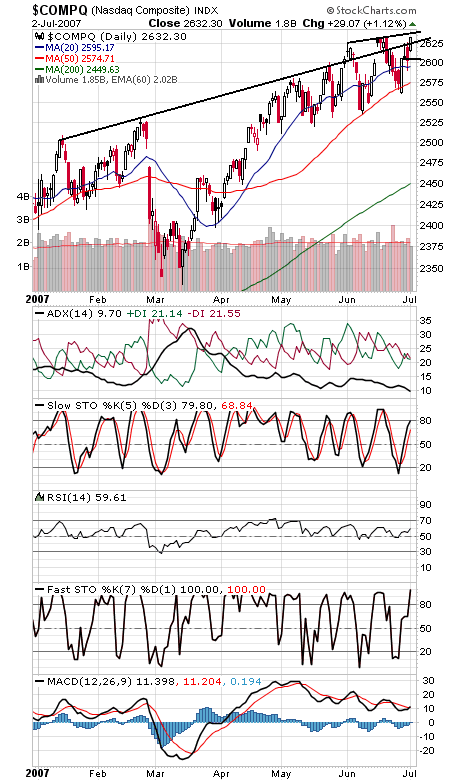
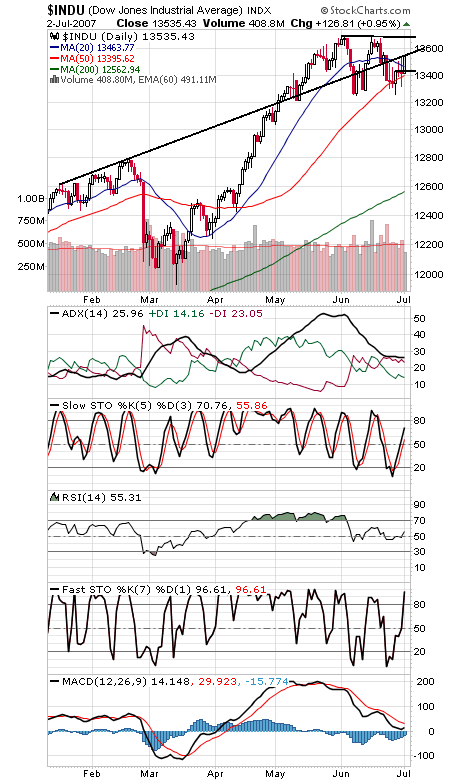
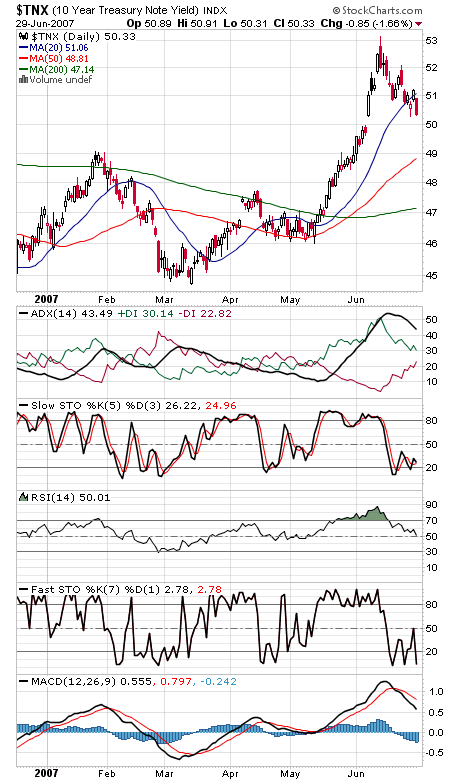
The S&P (first chart below) faces resistance at 1523-1525, 1535 and 1540, and support is 1516, 1510-1512 and 1507. The Nasdaq (second chart) has first resistance at 2635-2637, and support is 2615-2617 and 2605. The Dow (third chart) is facing a big hurdle right here. If it can clear it, it could be headed for its all-time high of 13,692-13,700, and support is 13,400-13,430. The 10-year yield (not updated due to bad data) blasted through 5.0% and 4.9% support today, the biggest reason for today’s rally. The bond bull may yet be alive.
Paul Shread is a Chartered Market Technician (CMT) and member of the Market Technicians Association


