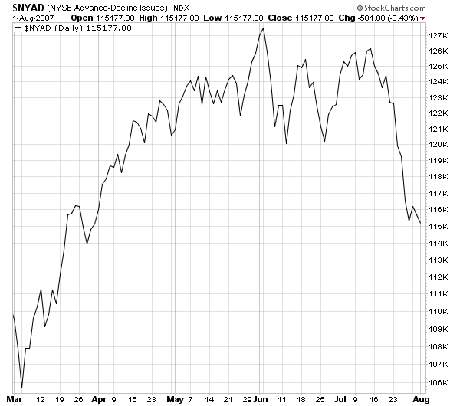
Another rally attempt by the bulls today. Have we finally had enough of a shakeout to get a good rally? We need to see some upside follow-though this time — and preferably in the form of a 90% upside volume day to give us an “all clear” signal. On a down note, the mild positive divergence in the NYSE advance/decline line (first chart below) that we noted yesterday disappeared today, as the broad list set a new low even as the major indexes rallied. Probably a good time to note that we have entered the weakest months of the year, but decades of market data suggest that major tops do not begin with the kind of intense selling we saw last week; rather, sell-offs tend to end with such capitulatory selling. But the nature of the coming rally will be an important indicator as to whether the decline is finished.
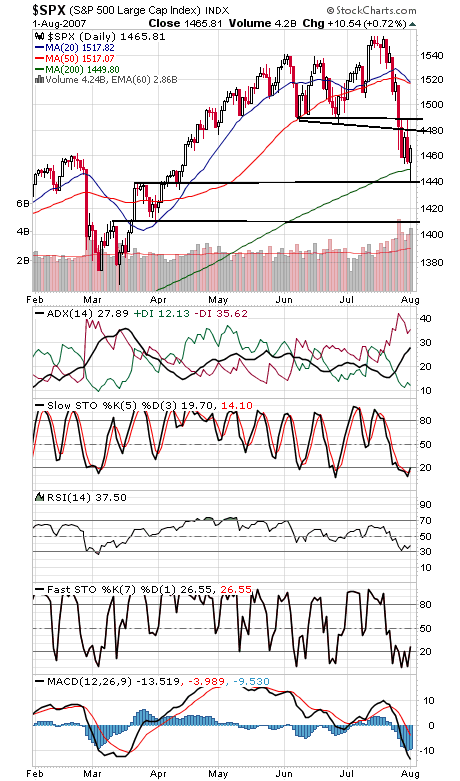
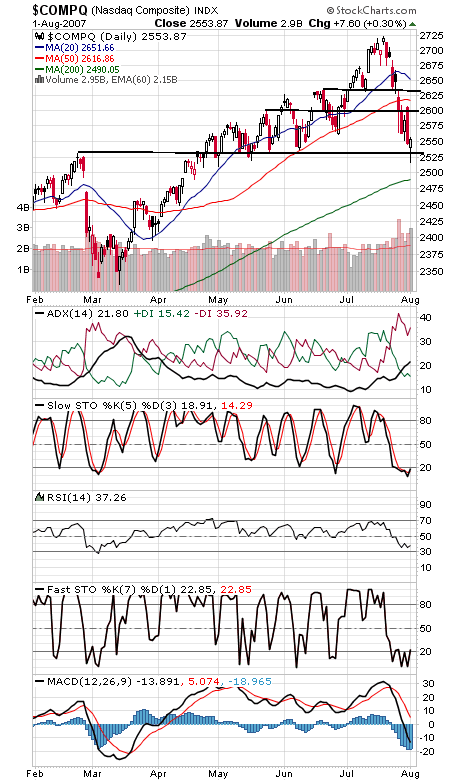
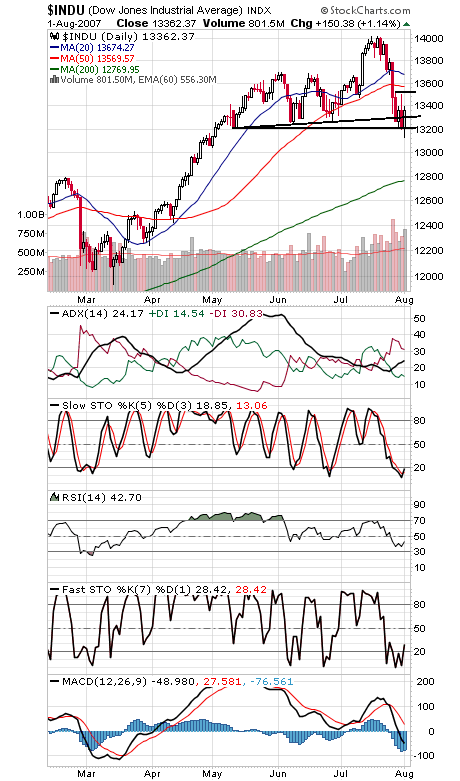
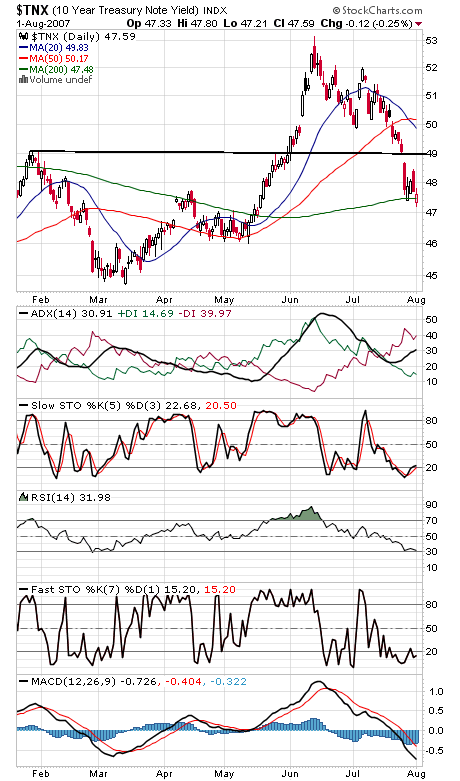
The S&P (second chart) went all the way to 1439 support before reversing; below that, 1410 looks like the next support. First support is 1450, and resistance is 1480 and 1488. The Nasdaq (third chart) violated 2531 support today before recovering, while resistance is way up at 2607-2617. The Dow (fourth chart) has support at 13,310, 13,250 and 13,200, and resistance is 13,500-13,520 and 13,565. Bond yields (fifth chart) remain in a strong downtrend, but at some point that trade will unwind and find its way into stocks.
Paul Shread is a Chartered Market Technician (CMT) and member of the Market Technicians Association