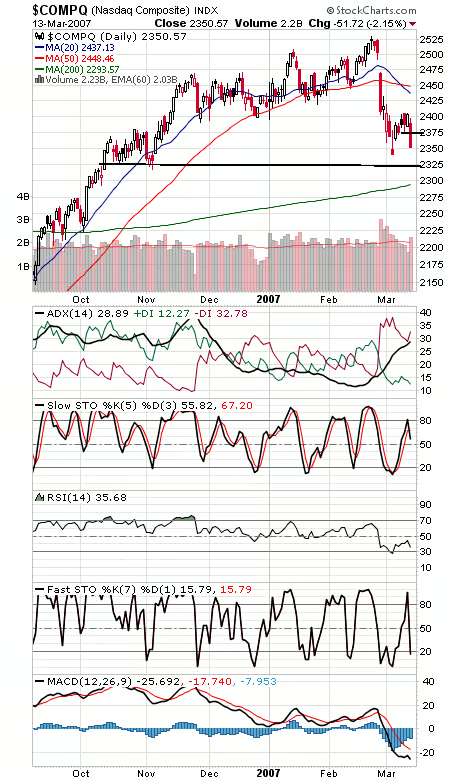
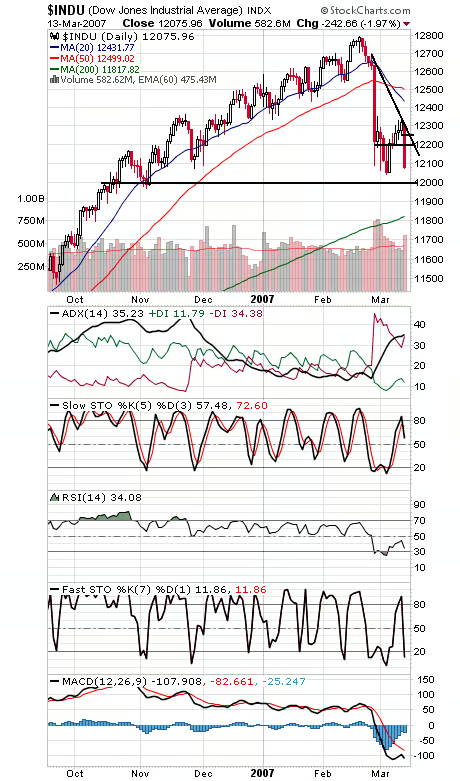
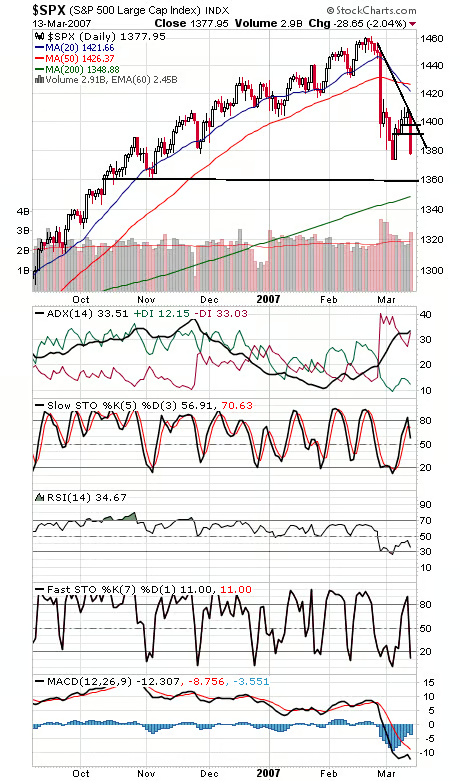
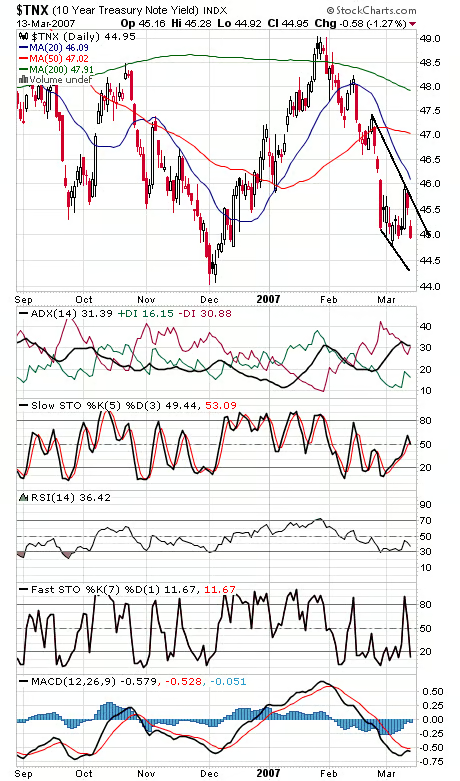
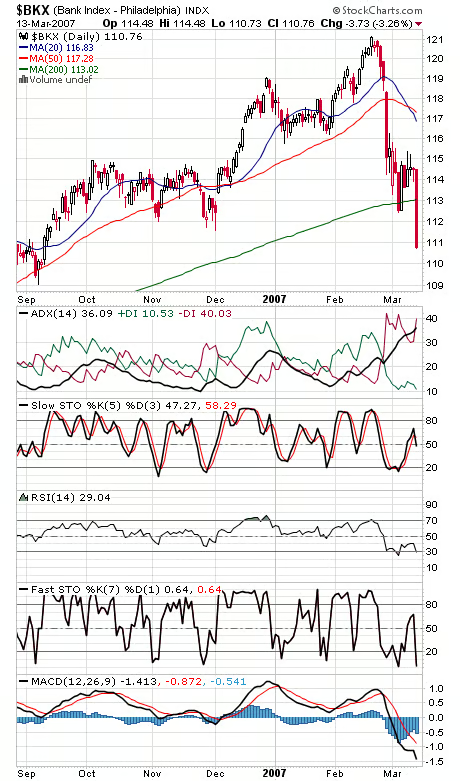
We have so many puts piling up that the bears can’t be right forever, but that doesn’t mean they can’t do some damage while they’re in control. We’re getting the retest of the lows we were looking for, but it’s coming a little faster and harder than we’d like, so we’ll look at a possible worst-case scenario tonight. We had another 90% downside volume day on the NYSE today, the third in this decline; that kind of panic selling will eventually produce a lasting bottom. Let’s assume for a moment that the market is in a three-wave correction off the highs — a leg down, a rally and then another leg down, similar to what we got last summer. If the Dow’s initial 750-point decline is duplicated from yesterday’s 12,350 peak, we get a target of 11,600 — just about at last May’s peak, which should provide good support, if the Dow’s previous all-time high of 11,750 can’t stop the selling first. Old highs make good support on pullbacks. A similar calculation on the S&P arrives at a 1323 target — right about at the May 2006 peak of 1327. It could well be that stocks don’t need to go that low; there’s been plenty of selling already, coming straight off of new multi-year highs. Let’s see how the market handles the recent lows of 12,039 on the Dow, 1274 on the S&P and 2340 on the Nasdaq. 2325 and 2300 are potential supports on the Nasdaq (first chart below), and 2375 is first resistance. 12,000 is an obvious support zone on the Dow (second chart), and 12,200 and 12,250 are resistance. The S&P (third chart) has support at 1360 and 1350, and resistance is 1390 and 1400. Treasury yields (fourth chart) are benefiting from flight to quality while banks (fifth chart) get hammered. Not a sector we want to see leading to the downside, one more reason the lows may not hold.