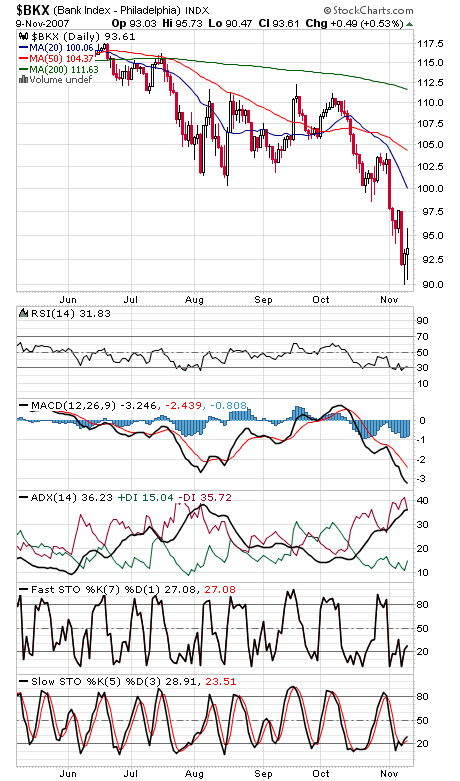
The financials (first chart below) got us into this mess, and now they’re trying to lead us out. The Philadelphia Bank Index gained for the second straight day despite a waterfall of bad news in the financial and tech sectors. Can the rest of the market follow? We’re still waiting for a 90% upside volume day to confirm that sellers have been exhausted.
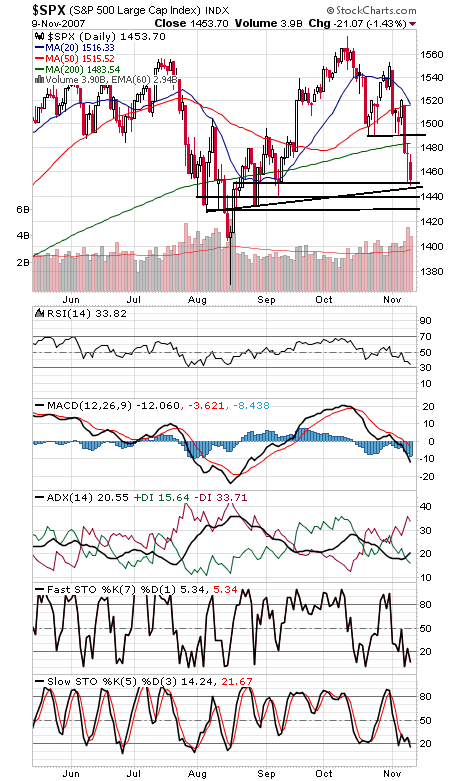
The S&P 500 (second chart) has very strong support between 1427 and 1450, so with any luck buyers will become emboldened here. To the upside, 1483 and 1490 are still the levels to beat.
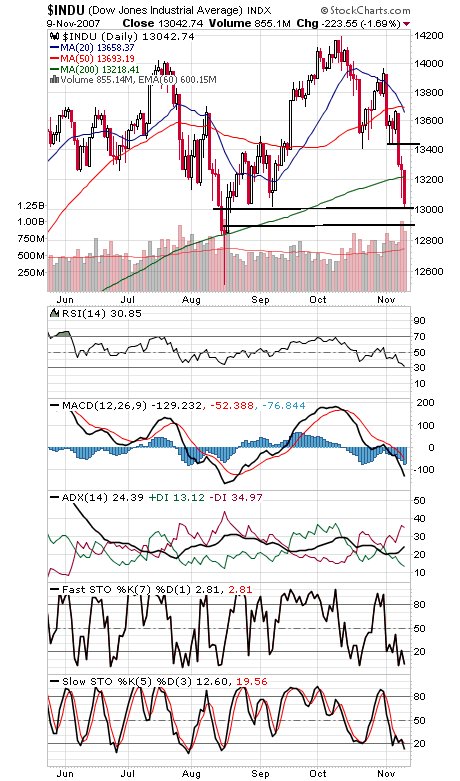
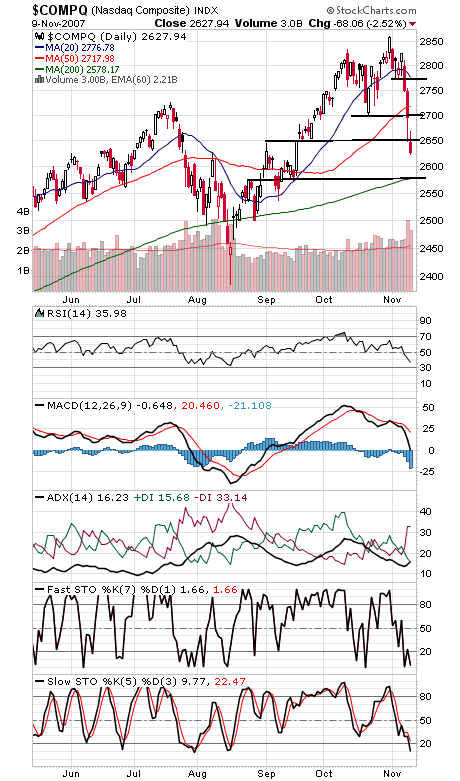
The Dow (third chart) has support at 13,000 and 12,900, and resistance is 13,220 and 13,450. The Nasdaq (fourth chart) really doesn’t have obvious support at this point until its 200-day average at 2578. 2650-2670 and 2700 are first resistance levels.
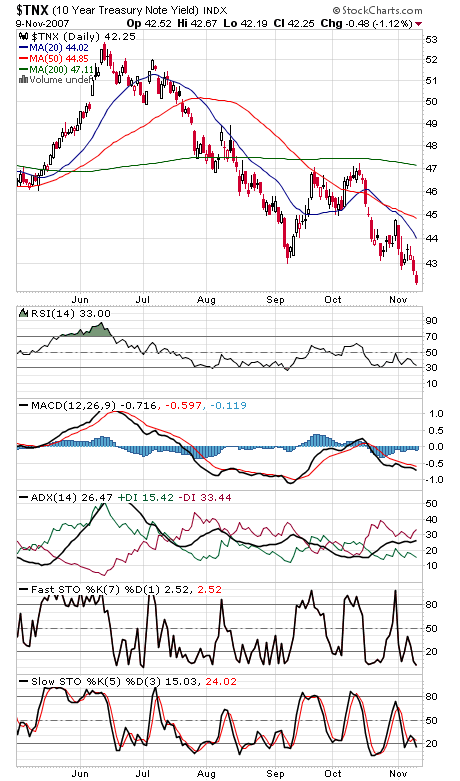
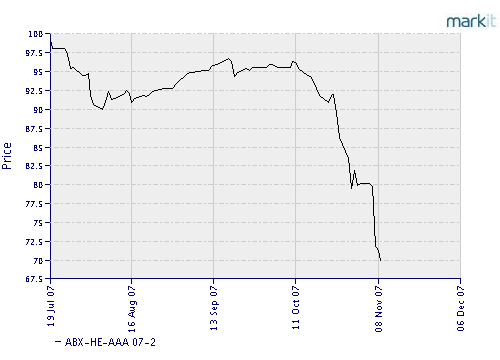
And finally, is it really any surprise that bond traders (fifth chart) are pricing in another rate cut? With the brutal selling in even the best of the subprime market (chart six, courtesy of Markit.com), there’s nothing about that market that suggests normal functioning.
Paul Shread is a Chartered Market Technician (CMT) and member of the Market Technicians Association.
