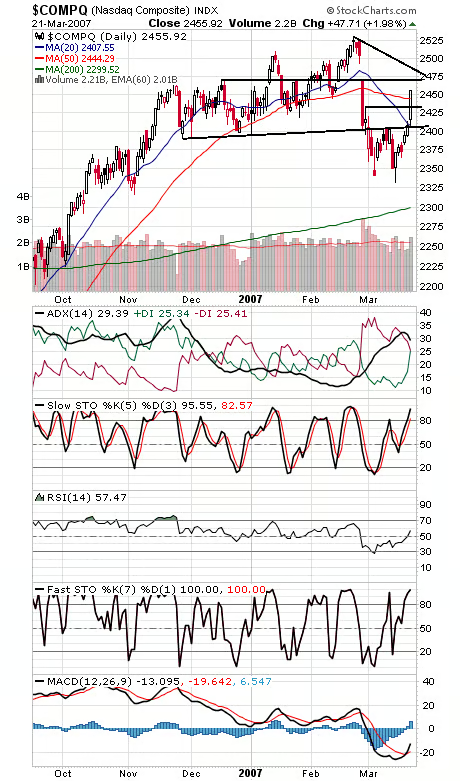
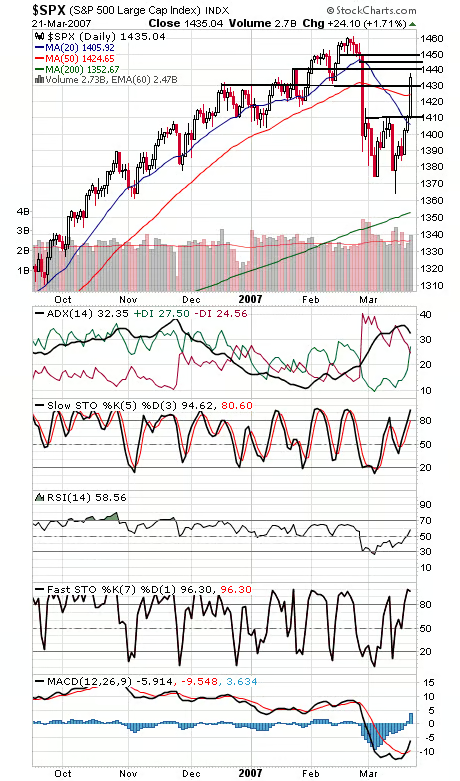
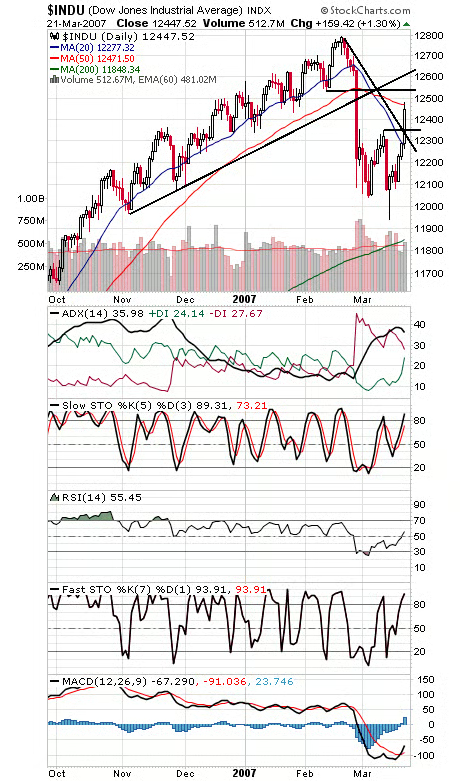
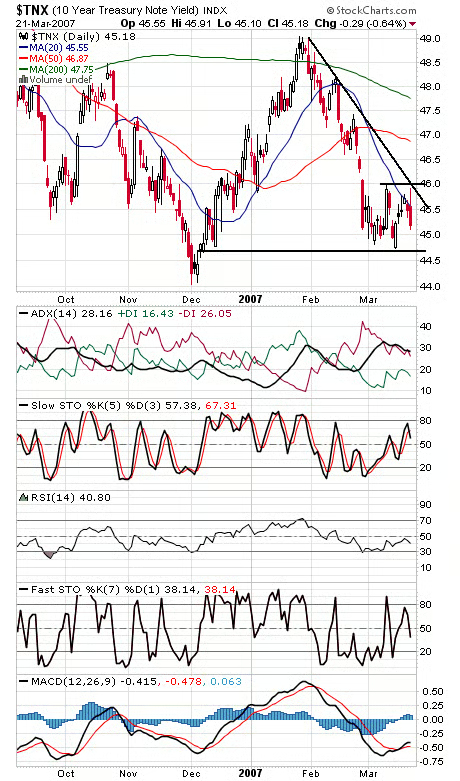
It came a few days later than we were hoping for, but we got another 90% upside day on the NYSE, additional evidence of a bottom here. Such “90-90” combos — severe selling followed by equally relentless buying — suggest a downside washout followed by buyers panicking that they sold too late. Such a sharp reversal in sentiment can cement a bottom. We also have nice looking double bottoms on all the indexes that should now function as strong support — if the indexes pull back that far. The Nasdaq (first chart below) gave us a hint of a bottom yesterday when it broke up back into its old December-February trading range, reversing its breakdown earlier this month and clearing a level that repelled the index two weeks ago. With the massive put buying we’ve seen in recent weeks, the market had plenty of upside fuel when traders got caught looking the wrong way. Support on the Nasdaq is 2450, 2445 and 2432, and resistance is — for those of you with long memories — 2471. The S&P (second chart) faces resistance at 1440, 1445 and 1450, and support is 2430 and 2425. is the S&P finally ready for a test of 1500? The Dow (third chart) is the one index that could retest today’s breakout, at 12,350, and resistance is 12,472, 12,500, 12,550 and 12,600. Bond yields (fourth chart) couldn’t quite reach the top of their trading range today; time to test the bottom?