The Federal Reserve is facing a historic test here — and appears to realize it.
Only twice in the Fed’s 94-year history have financial markets failed to respond to two or more Fed rate cuts — 1929-1932 and 2001-2002, putting both the Fed and the market at a critical juncture here (see Traders Sell The News from Jan. 31, 2001).
Since those two events occurred during two of the biggest bear markets of the last century, the market’s response to the Fed is of no small significance to traders here.
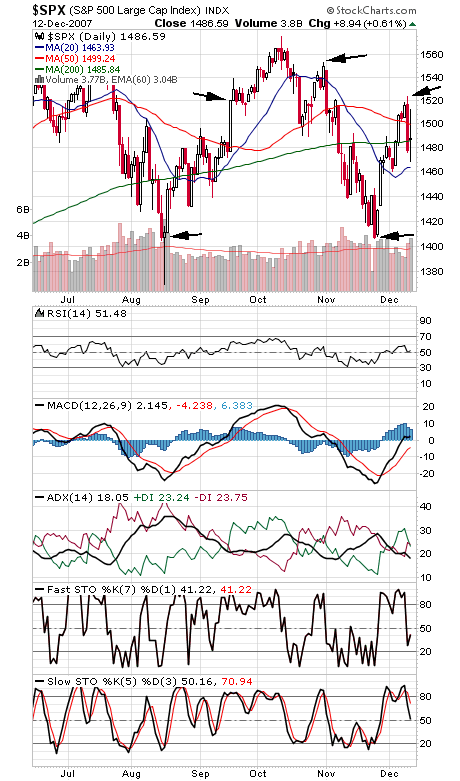
So using the S&P 500 (first chart below), we’ll mark a few key levels for Fed watchers here — all of which have, interestingly enough, played an important role in recent trading.
The Fed first cut the discount rate on August 17 before the market open. The S&P’s low last month was 1406-1407, just above its August 15 closing low of 1406 and just below the August 16 close of 1411.
The second discount cut and first fed funds cut on Sept. 18 carried the market from 1476-1520 — the trading range of the last two days was 1468-1523.
The third discount cut and second fed funds cut occurred on Oct. 31 at 1549 on the S&P, making 1520-1549 the level the S&P needs to beat to show that the Fed’s actions are gaining traction.
The Fed may claim that its rescue plan announced today had nothing to do with Tuesday’s sell-off on a Fed rate cut, but history shows the central bankers should be very concerned with the market’s reaction — and they likely are.
The bigger trading range remains 1406-1576 — and a break of either end of that range will be very important information for traders and the Fed.
Paul Shread is a Chartered Market Technician (CMT) and member of the Market Technicians Association.