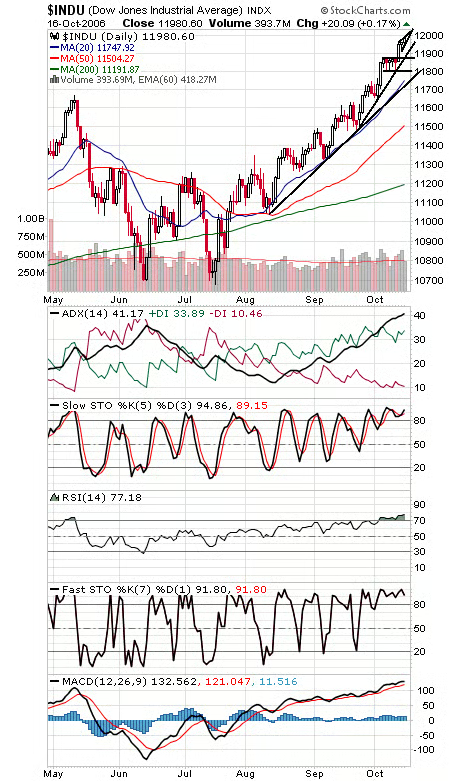
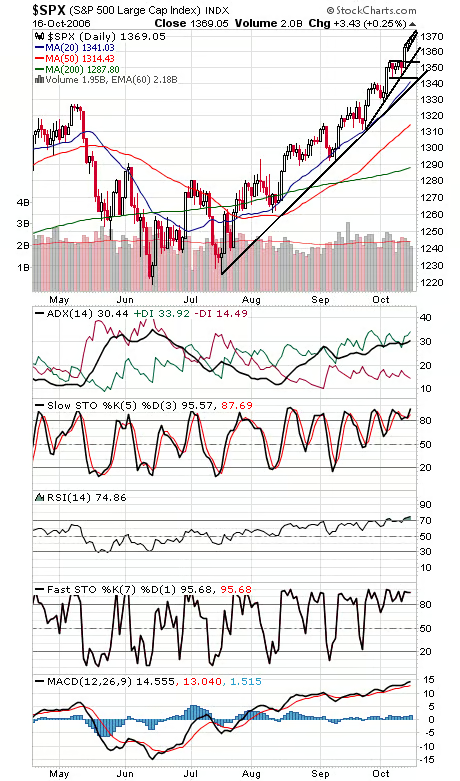
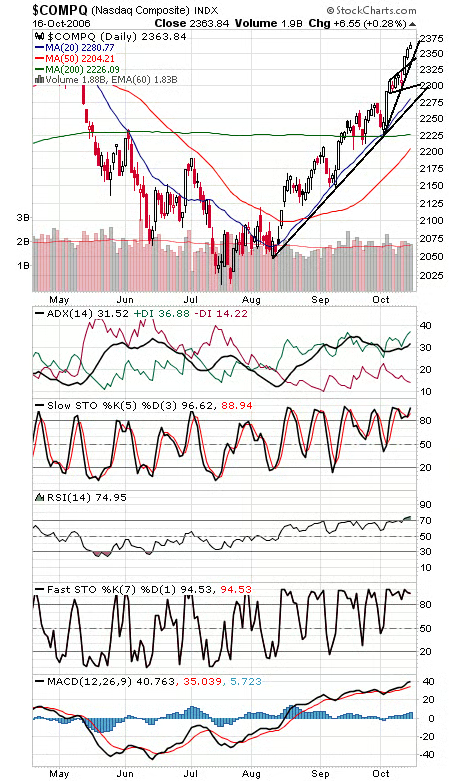
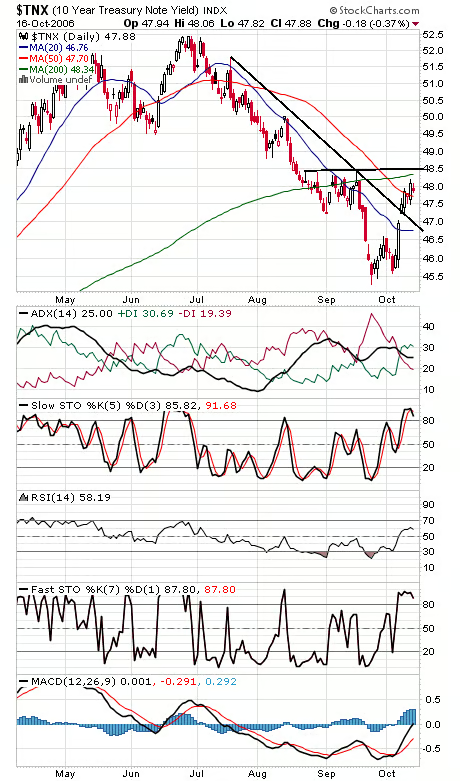
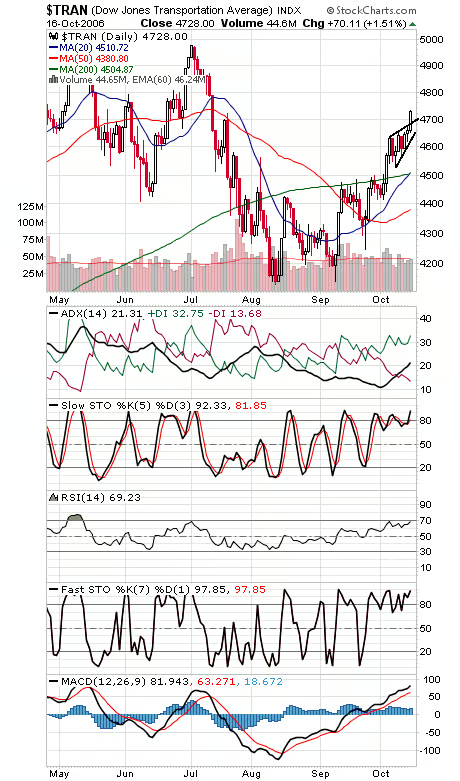
The market continues to levitate here despite some extreme overbought readings. In the long run, that’s a sign of strength, but in the short term, the market sure could use a breather. If we’re right about the market being in a fifth wave up here, the previous wave four low is one possible downside target: 11,800 on the Dow, 1344 on the S&P, and 2290-2300 on the Nasdaq. Dow 12,000 (first chart below) is obviously the big draw here, but the Nasdaq is approaching its post-2002 high at 2375.54, and the S&P is closing in on 1376-1389, its early 2001 peak. Support on the Dow is 11,900, 11,880, 11,800 and 11,722-11,750 (11,740). The S&P (second chart) has support at 1360, 1357, 1354, 1344 and 1340. The Nasdaq (third chart) has support at 2350, 2342 and 2325. Bond yields (fourth chart) should face tough going at 4.85%; above that level and they could be putting in a major bottom. Finally, Transports (fifth chart) put in one heck of a breakout today.