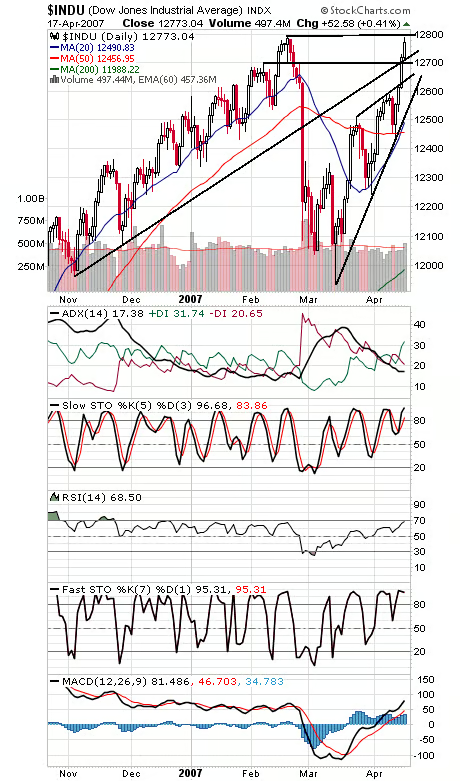
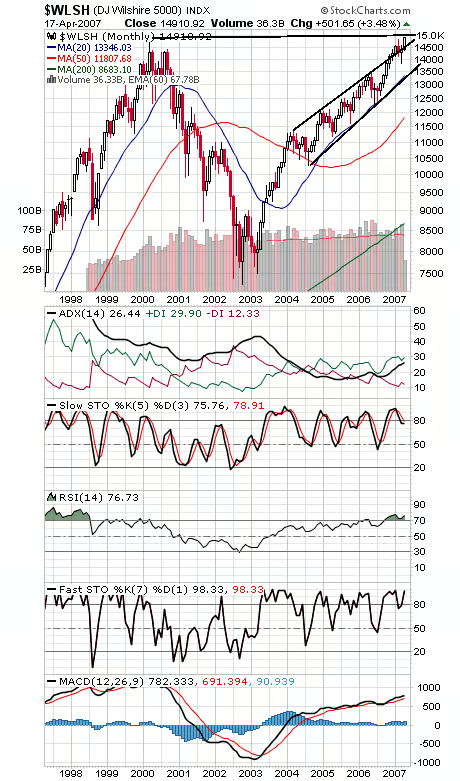
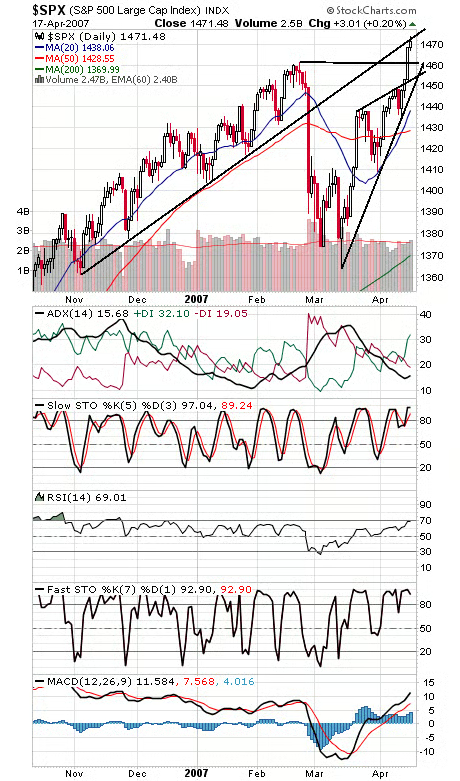
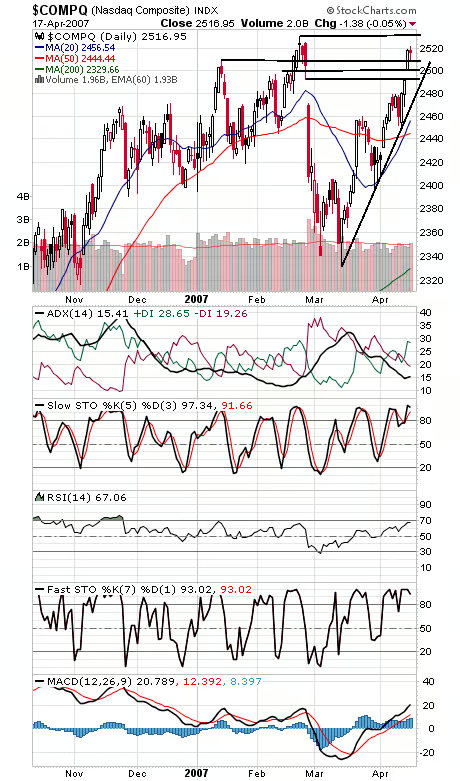
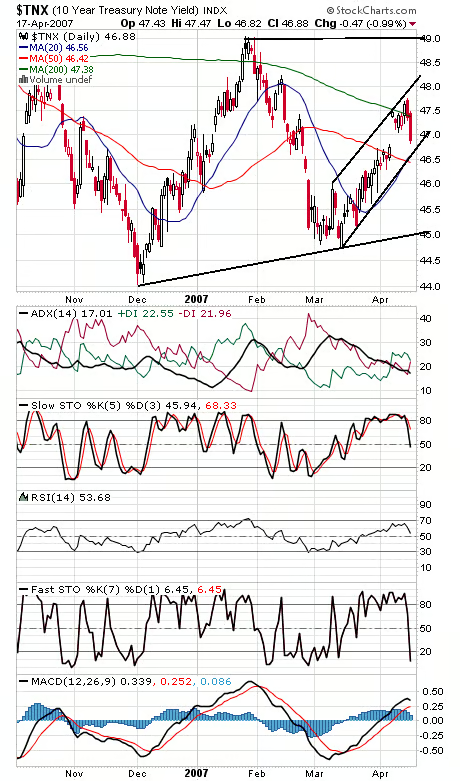
The all-time highs on the Dow and Wilshire 5000 (first two charts below) seem to be giving investors pause here. 12,796 is the level to beat on the Dow, and support is 12,700-12,720 and 12,650. The S&P (third chart) stalled at 1475 resistance, as expected. 1461, 1454 and 1450 are support. The Nasdaq (fourth chart) faces resistance at 2531, and 2510, 2500 and 2492 are support. Bond yields (fifth chart) turned sharply lower today and remain in a big range between 4.4% and 4.9%.