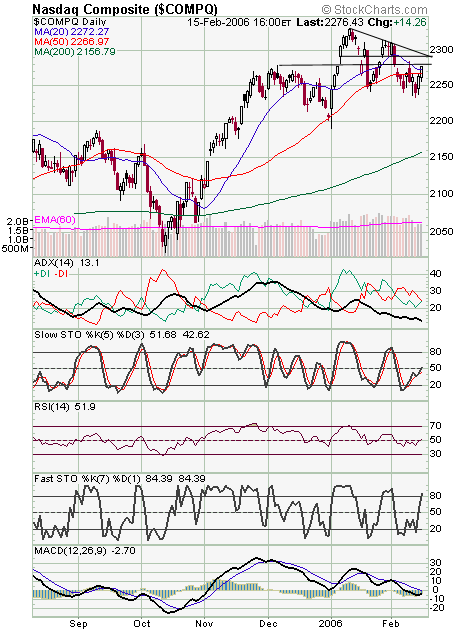
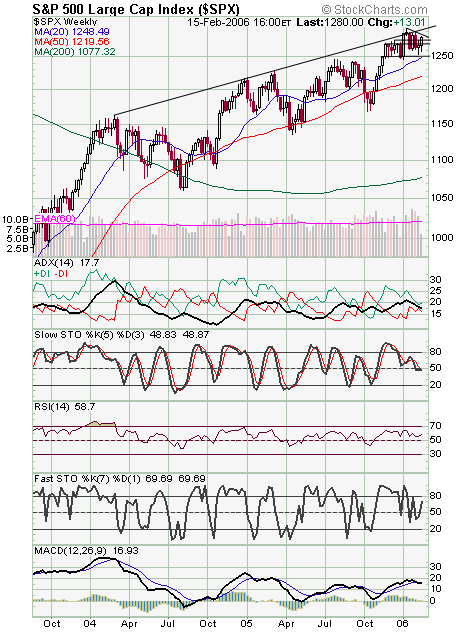
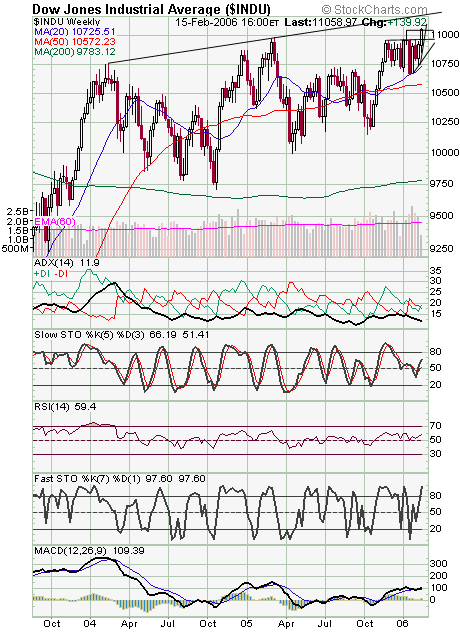
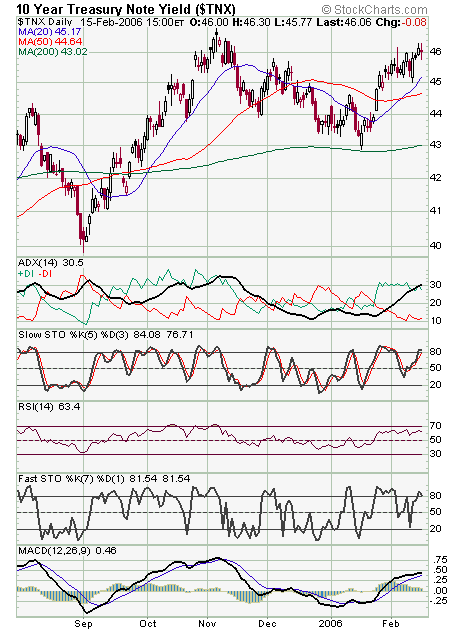
The Nasdaq (first chart below) continues to be the laggard here. Resistance is 2280, 2285 and 2290-2295, and first support is 2267. The S&P (second chart) faces resistance at 1283-1284 and 1293-1295, and support is 1275 and 1270. The Dow (third chart) continues to lead, and it looks like it could gain another 100-150 points without running into major resistance. Support is 11,000 and 10,960. Long bonds (fourth chart) finally paused here, but still continue to be troubling.


