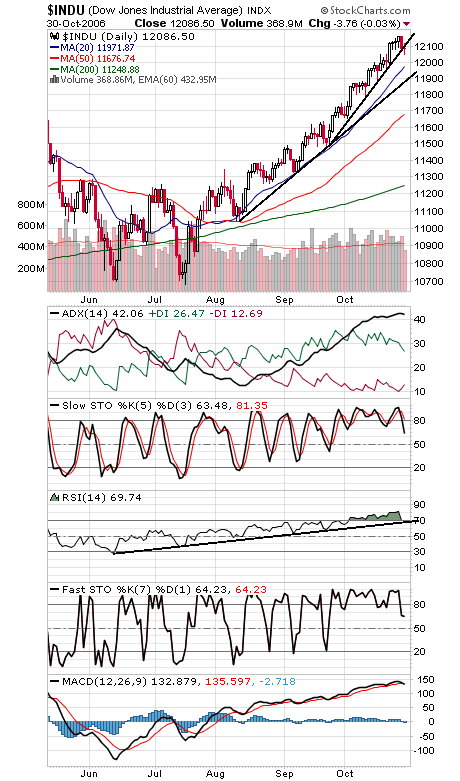
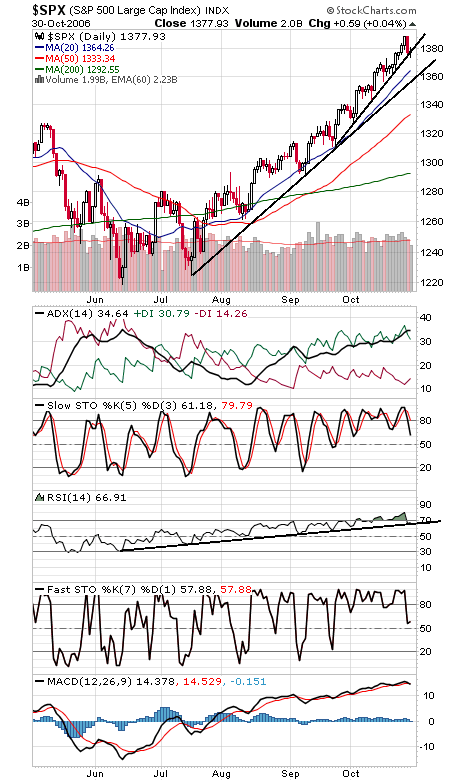
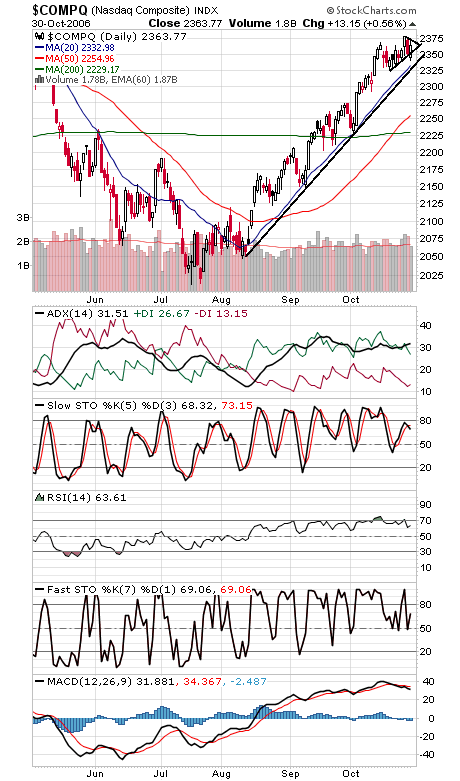
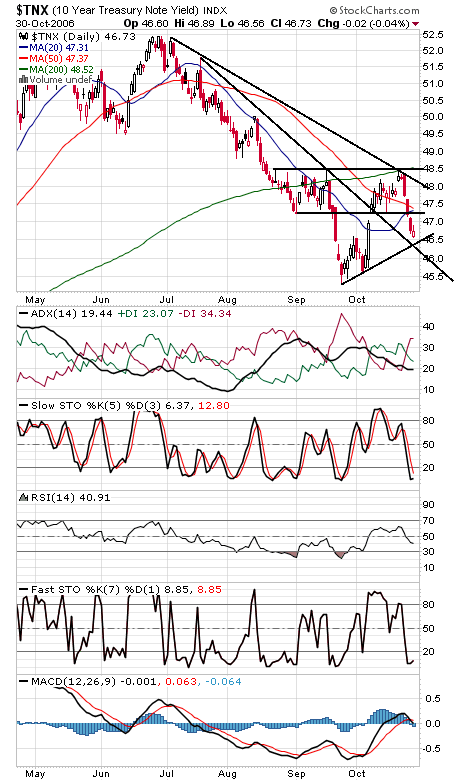
The Dow and S&P (first two charts below) are threatening their September uptrend lines here; a pullback to the main trendlines at 11,900 and 1358 could be in the cards if the big caps go much lower. First support levels on the Dow are 12,050 and 12,000, and 1373 and 1365 on the S&P. To the upside, first resistance levels are 12,130 on the Dow and 1380-1381 on the S&P. Note how the S&P is trying to hold support on its multi-month RSI uptrend line (indicators at bottom of chart). The Nasdaq (third chart) is also looking a little wobbly here, but its short-term outperformance in the last week has been a big source of support for the market here. Support is 2357, 2341 and 2333, and resistance is 2370 and 2380. Bond yields (fourth chart) are coming up on some support levels here. Finally, our picks for the next six months had a solid day, gaining 0.8% to beat the major indexes, but we won’t begin officially tracking their performance until tomorrow.


