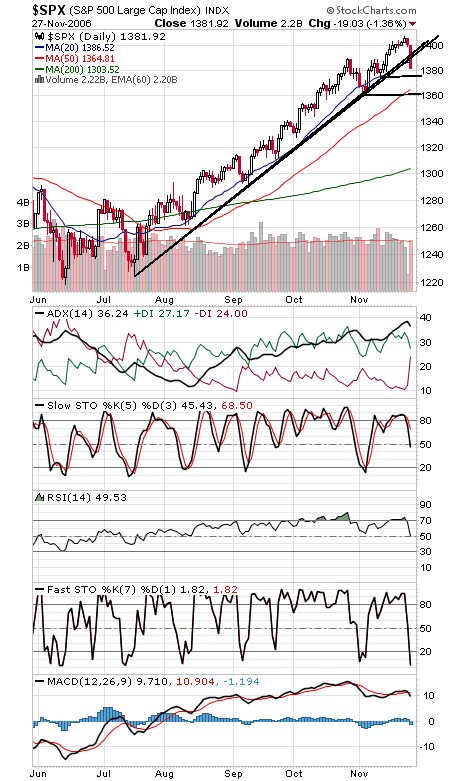
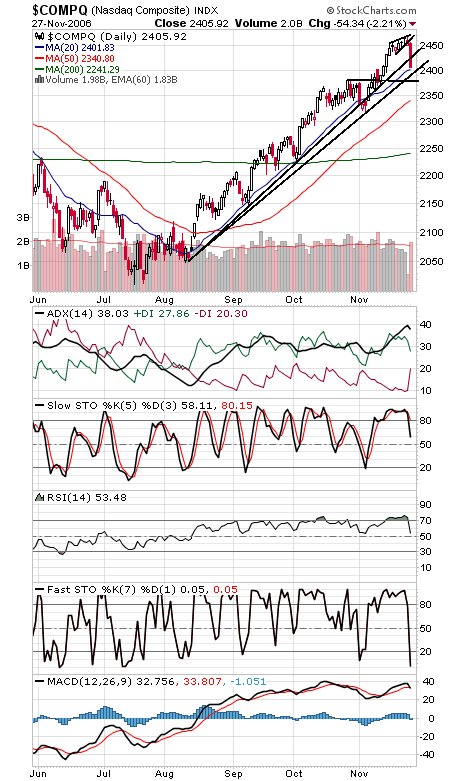
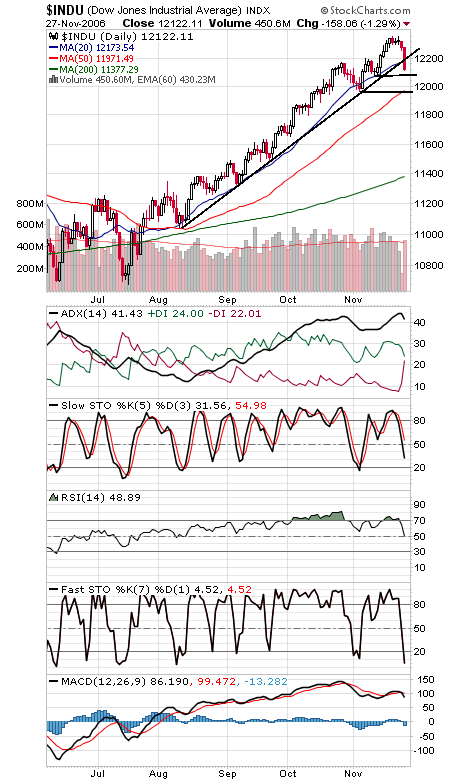
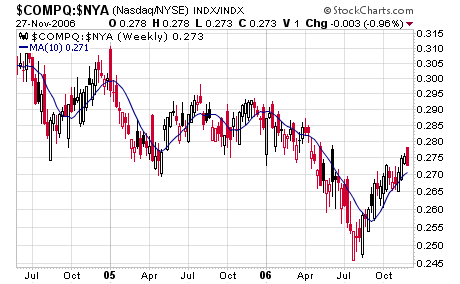
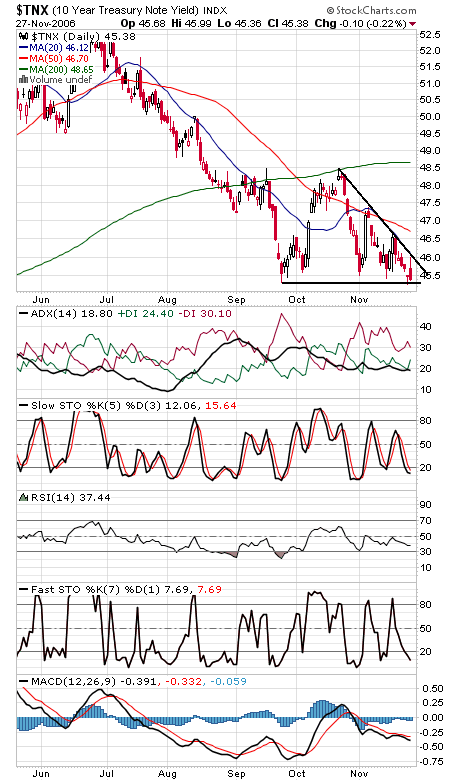
Major breakdowns across the board today, which suggests that the market’s multi-month rally may be done for now. The next important supports are the Dow and S&P’s lows earlier this month; below that and the odds increase that we’ve begun a significant correction. To the upside, those broken trendlines are now the levels to beat: 1392-1396 on the S&P; 12,210 on the Dow; and 2432 on the Nasdaq. Put-call ratios didn’t show excessive fear today, but we did get a 15% jump in the VIX, the options volatility index. The S&P (first chart below) has support at 1376, 1365 and 1360. The Nasdaq (second chart) has support at 2395 and 2380; the index sure looks like a breakdown out of a rising wedge or ending diagonal today. The Dow (third chart) has support at 12,080, 12,000 and 11,970. It’s worth noting that Appel’s Nasdaq-NYSE relative strength ratio (fourth chart) remains on a buy signal from early September, but one more day like today could take care of that. Bond yields (fifth chart) are facing decision time here; more flight-to-quality from stocks could certainly be a deciding factor. In short, important days ahead for the market here.