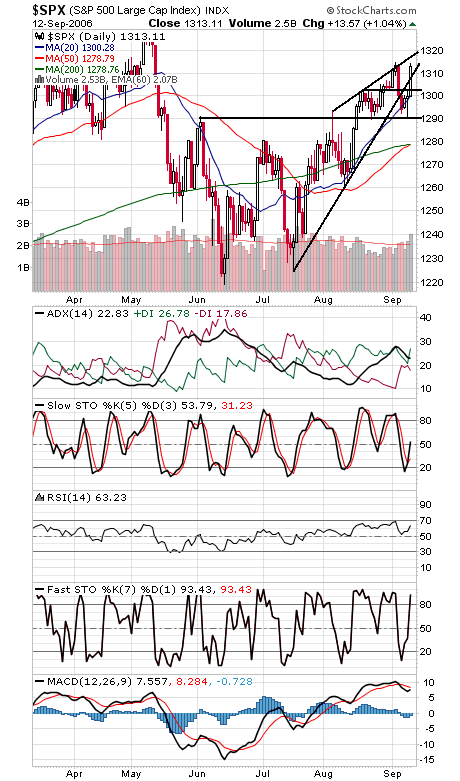
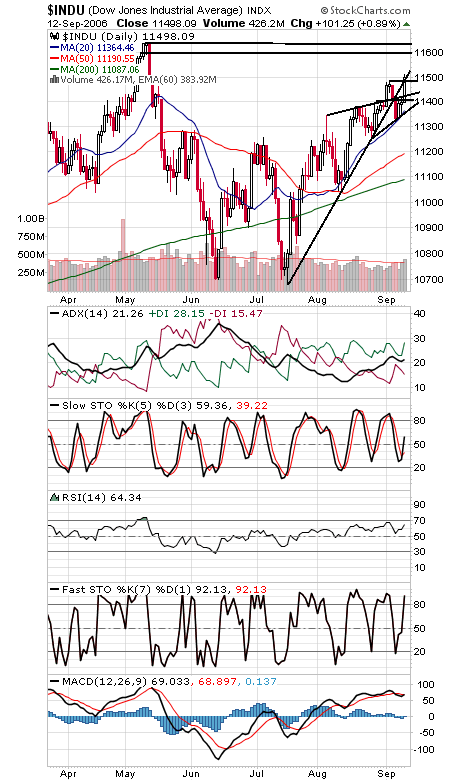
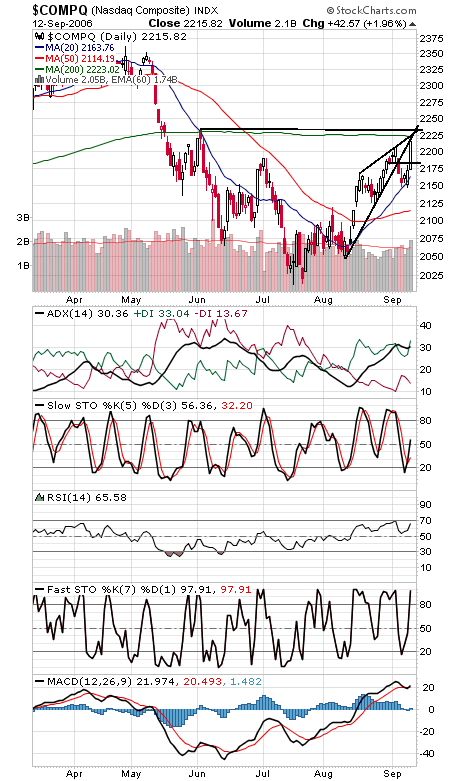
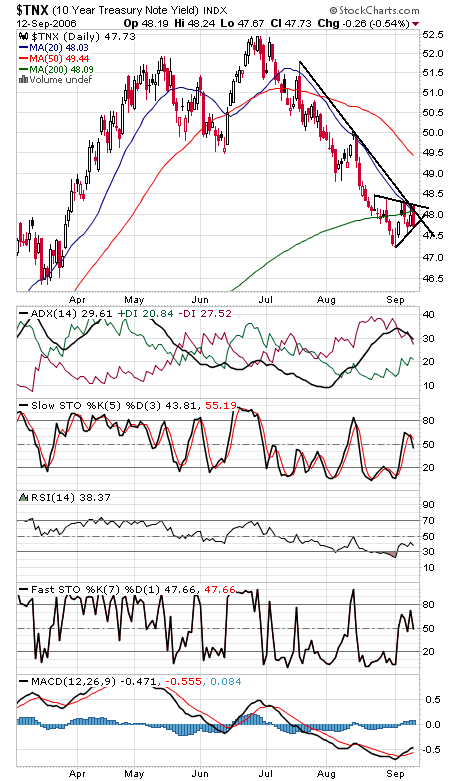
The S&P (first chart below) must have missed the memo about September being the weakest month of the year, because the index negated a pair of bearish patterns today. Once 1303 went, a test of 1309 resistance became likely, but even that couldn’t stop the index for long. The one thing that has propped up the market all year has been the high level of bearish sentiment among investors, which has so far made for the strongest mid-term election year since 1986. Before that, you’d have to go back to the 1950s to find the next example of a strong mid-term year. There’s still a few more months left in the year, but the cycles begin to turn positive in about four weeks. 1319 and 1327 are resistance, and 1309-1310 and 1303 are support. The Dow (second chart) looks like it has some room to run between here and 11,600, with 11,640-11,670 and 11,722-11,750 above that. Support is 11,480 and 11,400-11,430. The Nasdaq (third chart) is pushing its 200-day moving average at 2225, and 2235-2245 is a big resistance zone above that. Support is 2200 and 2183. Bonds (fourth chart) continue to have no problems finding buyers.


