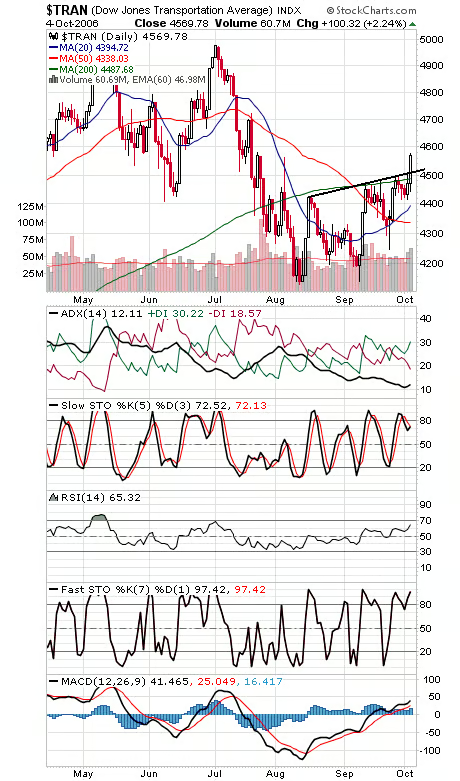
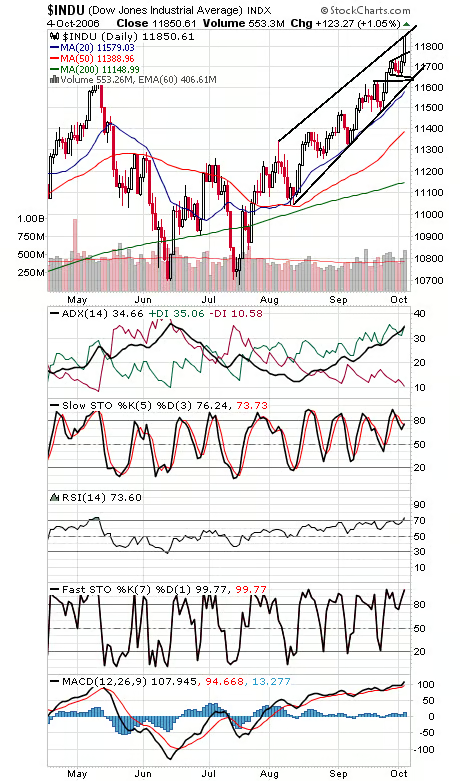
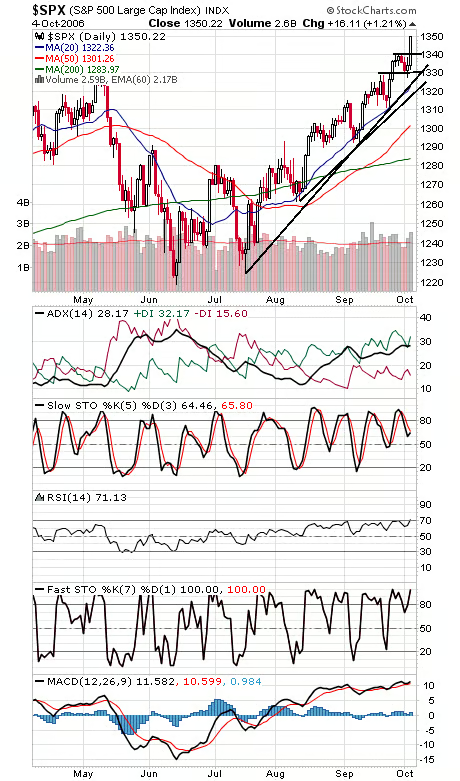
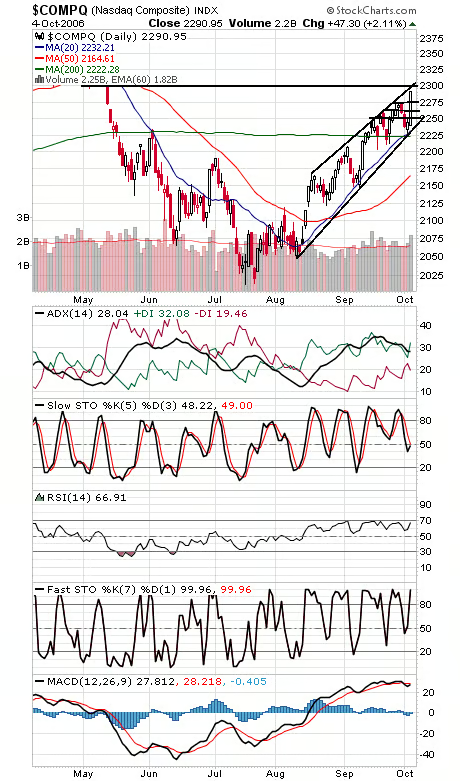
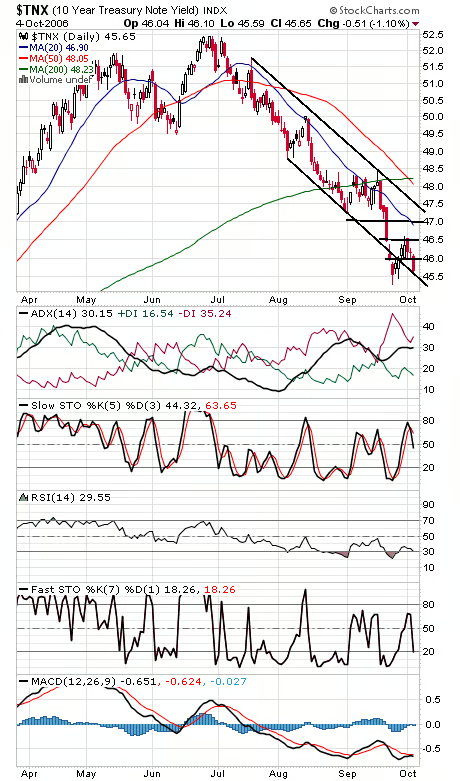
Market internals improved dramatically today (even the all-important Transports, first chart below, got in on the act), but we’re not so sure the market won’t have to pay the piper at some point for weeks of rallying with weak internals. In the entire 109-year history of the Dow, it’s hard to find a mid-term year that went straight up at this time of year, except for perhaps 1958, when the index had a short correction in mid-November that wiped out six weeks of gains. Still, the trend remains up until some significant support levels are broken. It’s worth nothing that ADX, +DI and -DI are nearly as stretched to the upside in the Dow (second chart) as they were to the downside at the June bottom. The Dow seems to have the cleanest trendline of the major indexes, at 11,620 and rising, so we’ll use that as critical support for now, but obviously 11,722-11,750 is a support level that everyone’s watching first. The S&P (third chart) also has a good-looking trendline at about 1326 and rising. Above 1350-1351, resistance can be found at 1361 and 1376-1389, multiple tops from early 2001. First support levels are 1340 and 1330. The Nasdaq (fourth chart) also has a solid uptrend line — way back at about 2235. 2275, 2260 and 2250 are first support levels, and resistance is 2293-2300 and 2325-2333. Bond yields (fourth chart) are pricing in three rate cuts here — it’s hard to believe that has yet to spook equity investors.