We should have pointed it out yesterday, but it’s once again time to cite a study by Robert Colby (Encyclopedia of Technical Market Indicators) that cash remains the best option historically from Sept. 5 to Oct. 27. Over a century of market history, that was the correct place to be 62% of the time and vastly outperformed buy and hold. That said, we’re not so sure we’re headed for a disaster this year, given the number of bullish indicators we’ve seen over the last month, but it’s hard to argue with more than 100 years of market history.
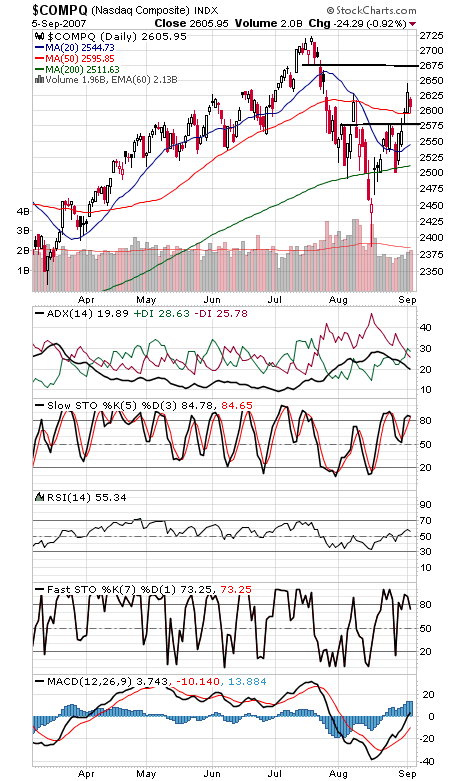
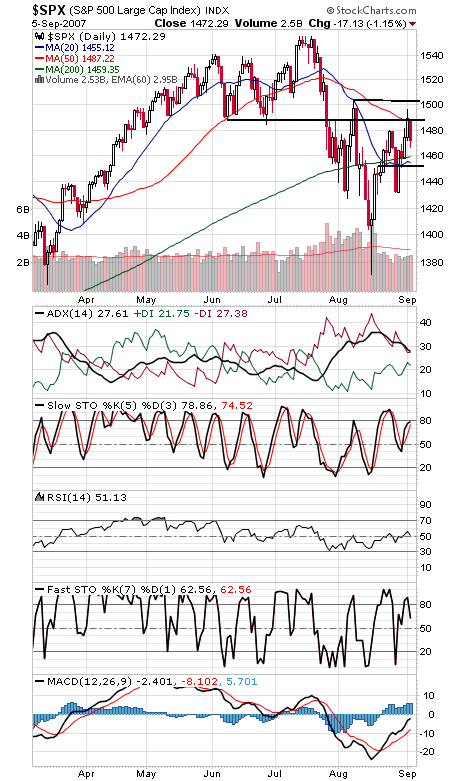
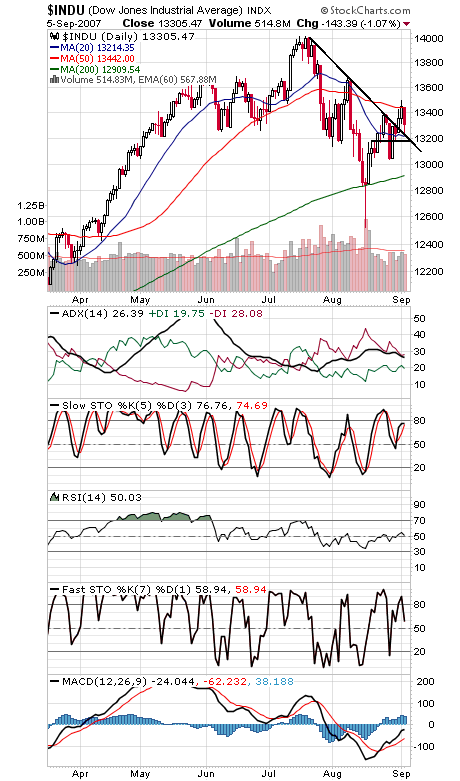
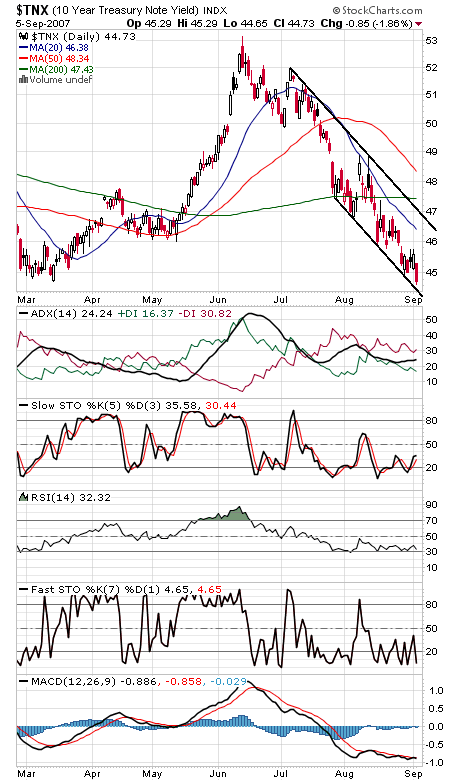
The Nasdaq (first chart below) held its 50-day average today, with 2576 the next support level below that. Resistance is 2618-2621, 2628-2634, 2650 and 2675. The S&P (second chart) has support at 1460 and 1455, and resistance is 1476, 1488, 1496 and 1504. The Dow (third chart) has support at 13,250 and 13,182, and resistance for the blue chips is 13,336, 13,375-13,387, 13,442 and 13,500. It was the lowest close of the year for the 10-year yield (fourth chart), which apparently isn’t done pricing in rate cuts just yet.
Paul Shread is a Chartered Market Technician (CMT) and member of the Market Technicians Association


