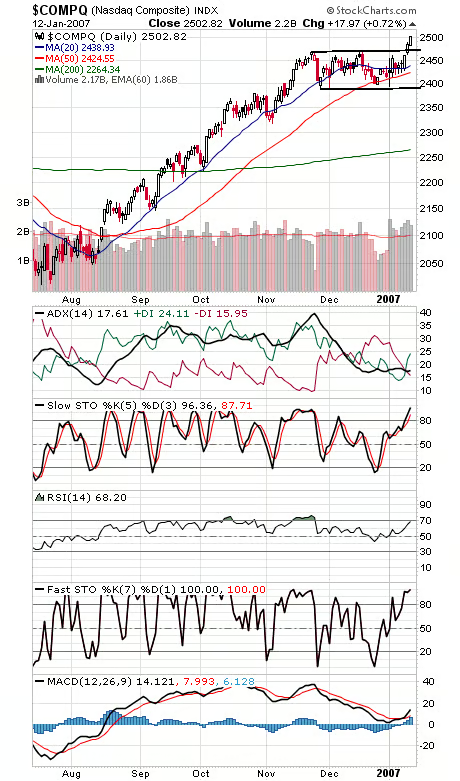
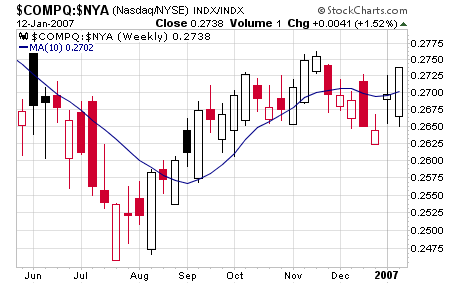
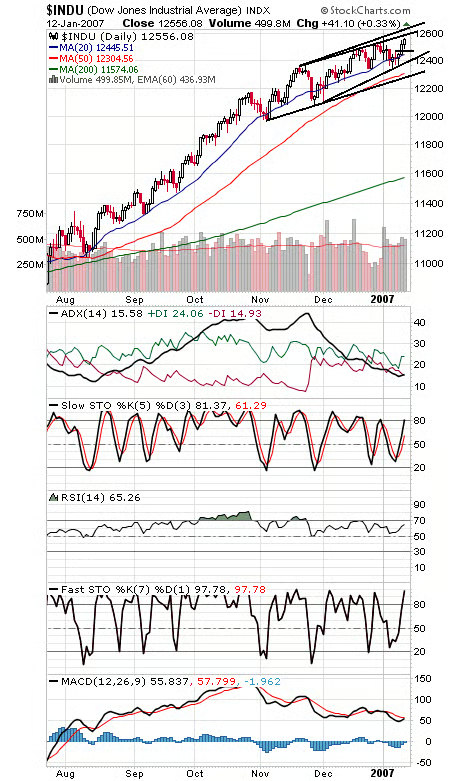
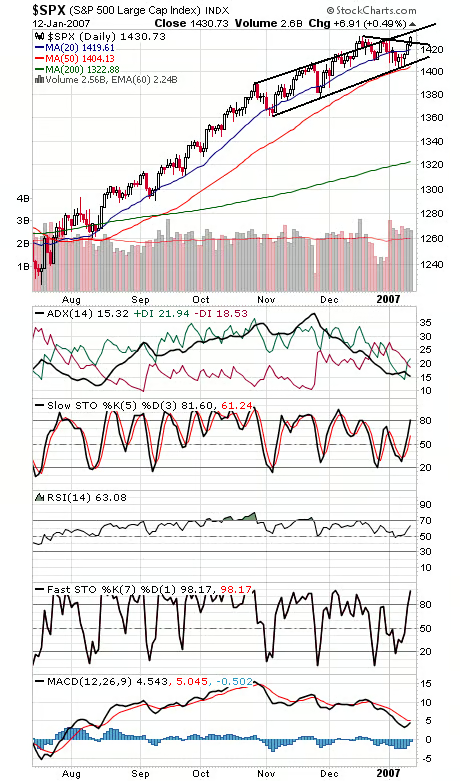
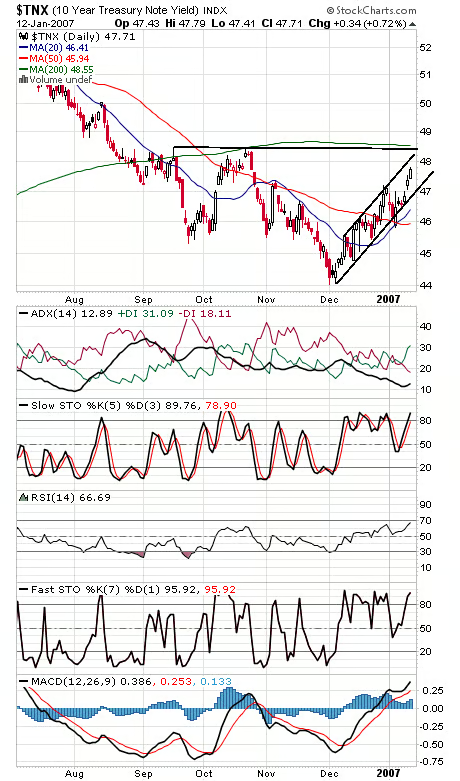
The Nasdaq (first chart below) remains in solid breakout mode and has added to its outperformance over the NYSE since last week’s buy signal (second chart). All that despite a lack of participation from chip stocks the last couple of days. To the downside, support is 2493, 2488, 2481 and 2471. To the upside, it’s hard to see much resistance until 2536, with 2550 and 2590 above that. The Dow (third chart) faces resistance between here and 12,600, and 12,490-12,500 and 12,466 are support. The S&P (fourth chart) is about a point away from a breakout, although it could start running into resistance above starting at about 1435-1438. To the downside, 1426-1427 should be solid support. Bonds (fifth chart) continue to take a beating, which stocks are so far taking as a sign of good news and economic strength.