Technical Analysis: Bulls Take a Break | Internet News

Technical Analysis: Bulls Take a Break

Written By
Paul Shread
Paul Shread
Sep 15, 2006
1 minute read


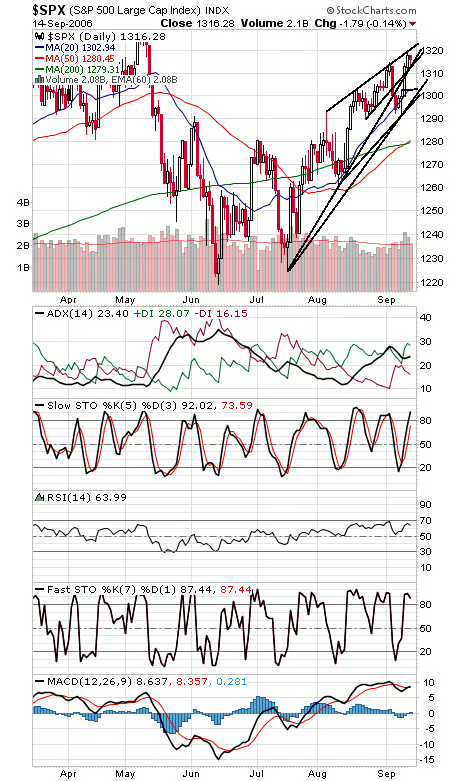
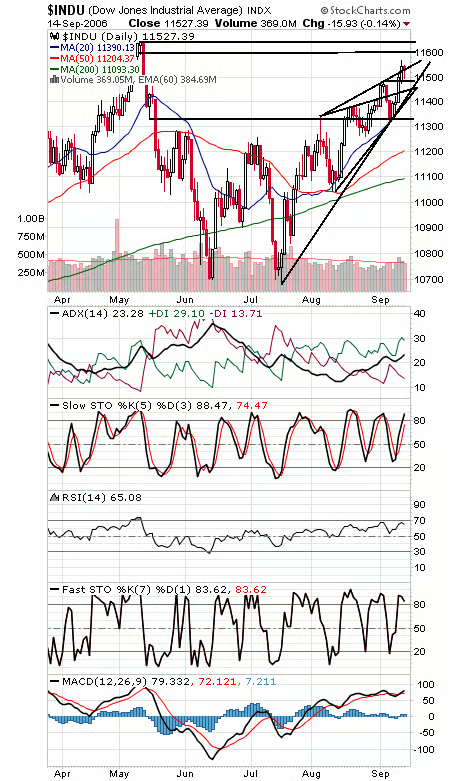
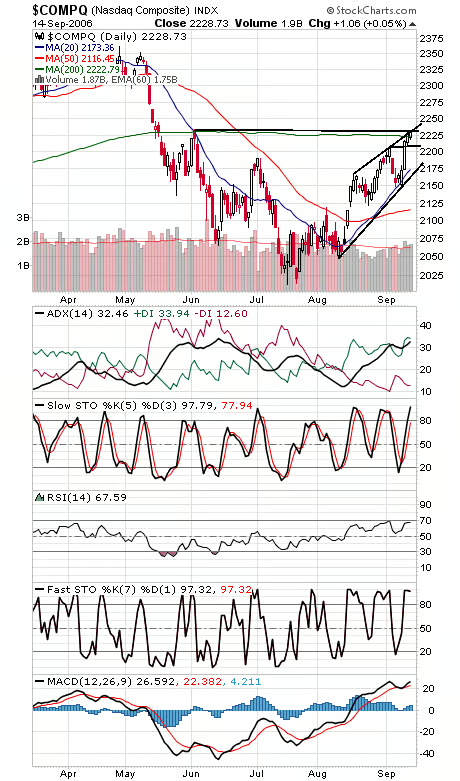
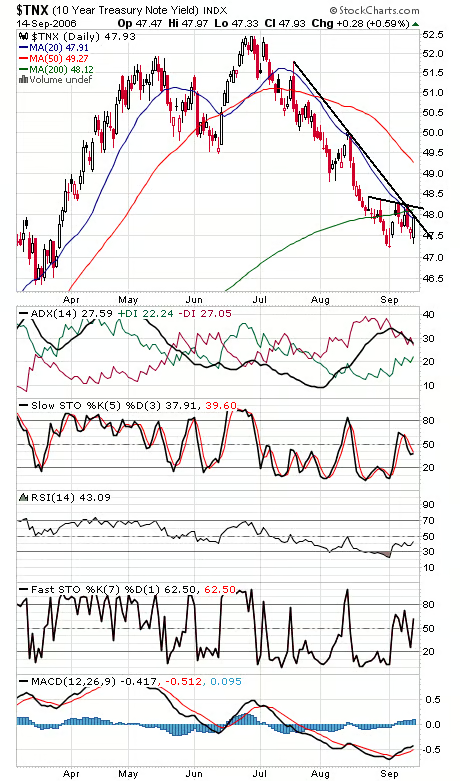
Lots of indecision today ahead of tomorrow’s CPI report and expiry, with the S&P and Dow (first two charts below) putting in “inside days” completely within yesterday’s trading range. One negative we’d note is that internals — advance-declines and up/down volume — were much weaker than the indexes, a sign of eroding support here. The S&P (first chart) faces resistance at 1321-1323 and 1327, and 1311-1315 is first support. The Dow (second chart) faces resistance is 11,567, 11,600 and 11,640-11,670, and support is 11,480-11,500, 11,450 and 11,400. The Nasdaq (third chart) is holding up admirably at its 200-day average. 2234 and 2245 are the next big levels, and 2218, 2207-2211 and 2200 are support. Quite a reversal in bonds (fourth chart) today; the start of a long-awaited correction?


Internet News Logo

InternetNews is a source of industry news and intelligence for IT professionals from all branches of the technology world. InternetNews focuses on helping professionals grow their knowledge base and authority in their field with the top news and trends in Software, IT Management, Networking & Communications, and Small Business.

Property of TechnologyAdvice. © 2026 TechnologyAdvice. All Rights Reserved

Advertiser Disclosure: Some of the products that appear on this site are from companies from which TechnologyAdvice receives compensation. This compensation may impact how and where products appear on this site including, for example, the order in which they appear. TechnologyAdvice does not include all companies or all types of products available in the marketplace.