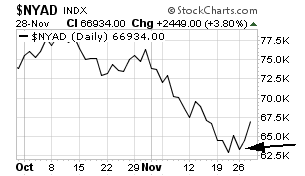
The bulls are giving it another shot here, and this one looks a little more promising than the last couple of attempts. For starters, we had a higher low in the NYSE advance/decline line (first chart below) when the indexes made lower lows on Monday, a positive divergence that suggests accumulation by buyers.
And today, we had another 90% upside day on the NYSE, broad-based buying that can mark the end of a decline. The two previous attempts in this area failed, but this one comes with some evidence of accumulation, not to mention skepticism by small options traders.
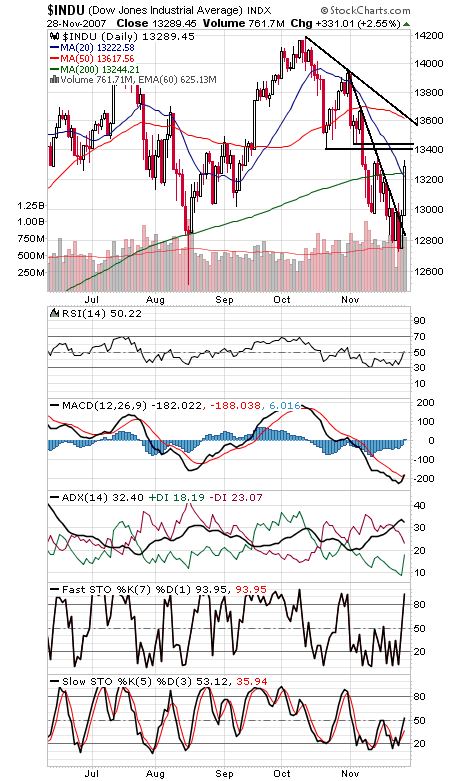
On top of that, we also got a MACD buy signal on the Dow today (second chart below), a sign that the seasonally positive period for stocks may finally be starting, according to the work of Sy Harding. A good time to pick up our stock picks at a 10% discount?
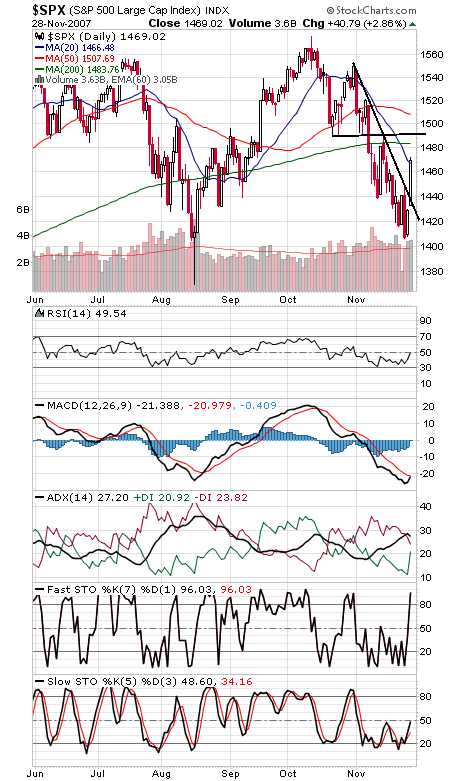
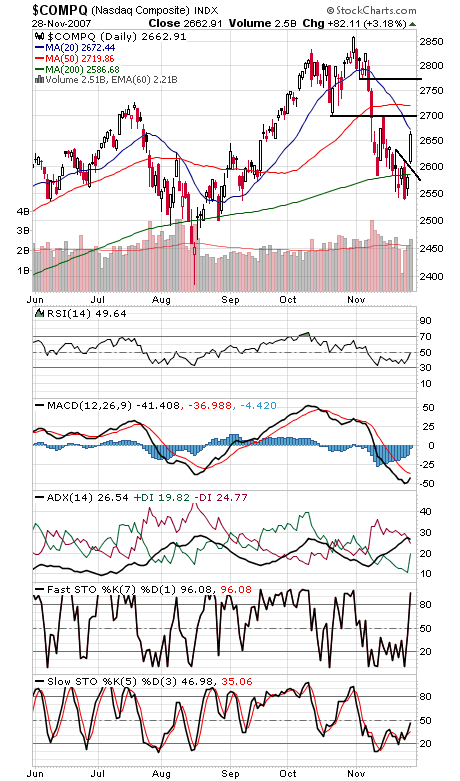
To the upside, some very important resistance levels remain, including 13,407-13,447 on the Dow, 1484 and 1493-1500 on the S&P (third chart below — note that nice downtrend line break today), and 2700, 2720 and 2774 on the Nasdaq (chart four).
The market could also get hit with some profit-taking after the big run-up of the last two days. Possible support levels are 2633-2640 and 2607-2613 on the Nasdaq, 13,244 and 13,200 on the Dow, and 1460-1462, 1450-1452 and 1446 on the S&P.
There also remains the problem of last week’s Dow Theory sell signal, but as we noted on Monday, it is a long-term trading system that takes a long time to reverse and does not preclude an intermediate-term rally. Still, it is worth keeping in mind for the long view; it certainly suggests a weakening economic backdrop and a long-term divergence that the market will have to overcome.
Paul Shread is a Chartered Market Technician (CMT) and member of the Market Technicians Association.


