We have an extremely oversold market coupled with extreme pessimism (the latest Investors Intelligence weekly survey showed 47% bears and 27% bulls, the most extreme reading since 1994-1995), but we won’t get a bottom until we see buyers come rushing back into this market.
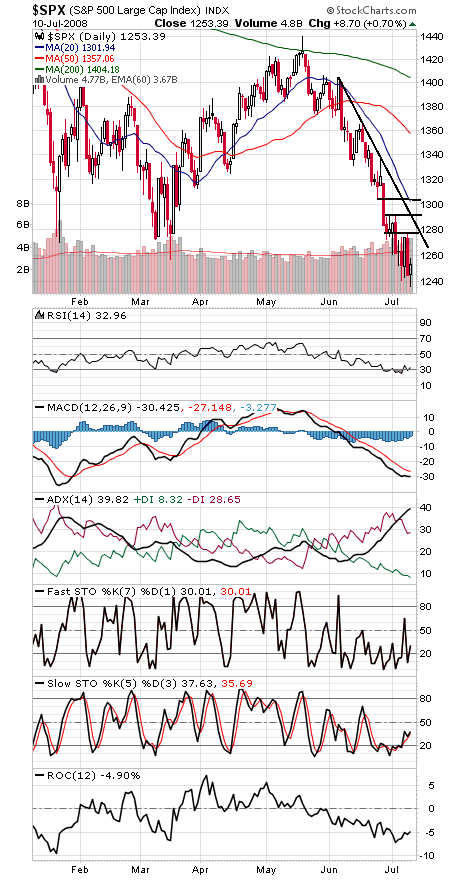
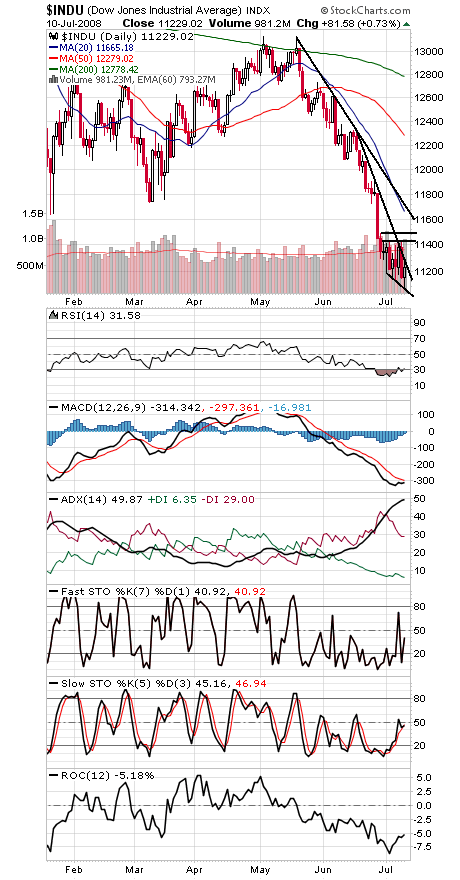
The 2006 lows appear to be the most likely spot to look for that to happen. That would be 1219-1236 on the S&P (today’s low was 1236.76) and 10,683-10,739 on the Dow. Mid-term lows have held for at least a few years since 1934, and conditions appear ripe for that trend to continue.
The S&P (first chart below) keeps making lower highs here; breaking that pattern with a move above 1277 would be a good start. Above that, 1286, 1292 and 1304 are the next resistance levels.
The Dow (second chart) needs to clear 11,434-11,485 to break the cycle of lower highs, and 11,634-11,750 is an even bigger level above that.
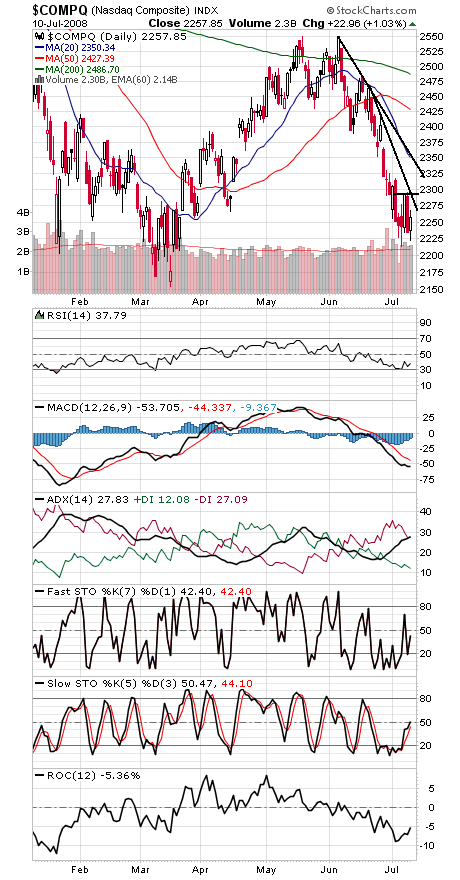
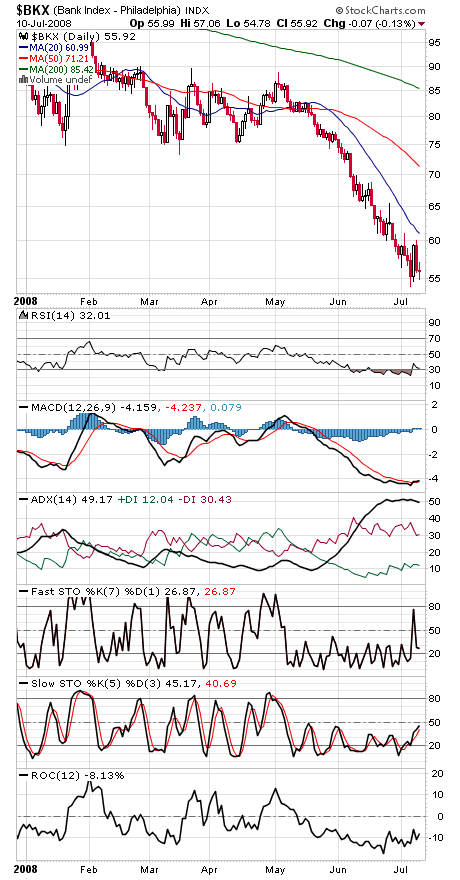
The higher low today in the Nasdaq and bank stocks (third and fourth charts) is a minor positive divergence from the Dow and S&P, which set new intraday lows today, but again, we need to see buyers step up in force. 2200-2214 and 2155 are support on the Nasdaq, and 2276 and 2294 are first resistance levels.
Paul Shread is a Chartered Market Technician (CMT) and member of the Market Technicians Association.


