SHARE
Facebook X Pinterest WhatsApp

Technical Analysis: Bye-Bye Breakout

Written By
thumbnail
Paul Shread
Paul Shread
Mar 1, 2006

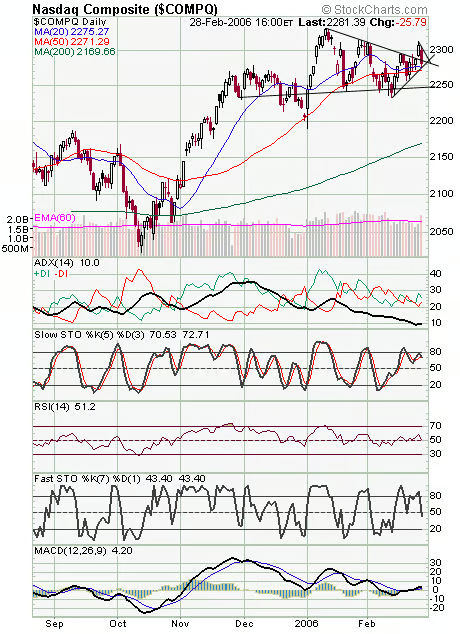
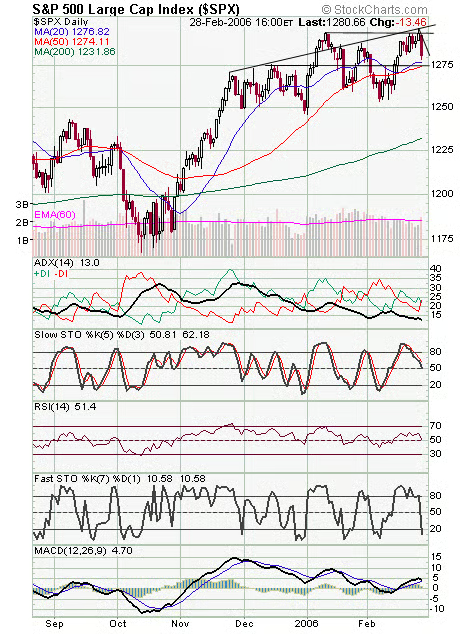
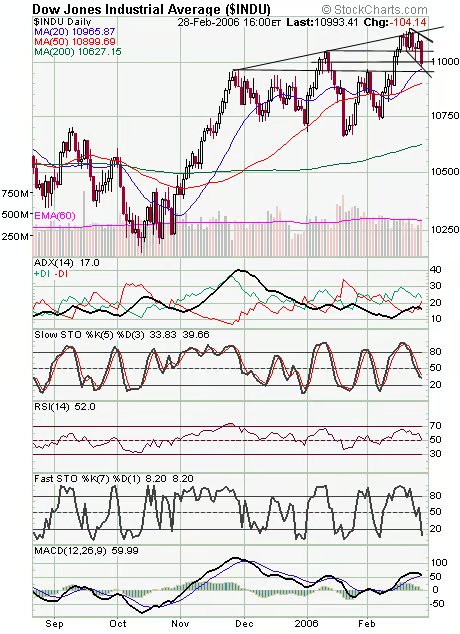
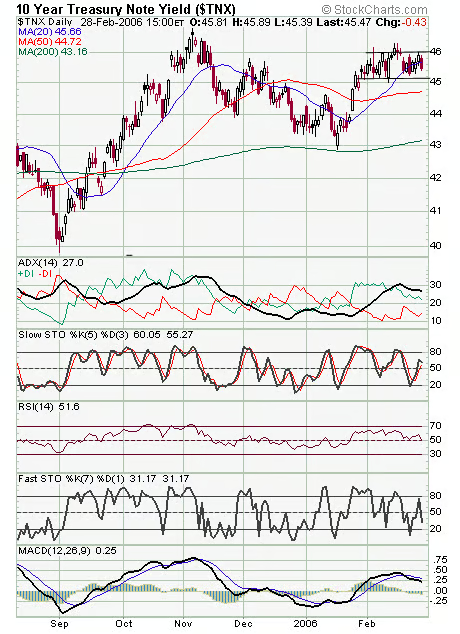
The Nasdaq’s (first chart below) big breakout lasted all of a day. That said, it wouldn’t take much of a gain to reclaim that line; call it 2284 for tomorrow, which also marks first of the month inflows. The next resistance levels are 2291 and 2297-2300, and support levels are 2280 and 2271. The S&P (second chart) has a big support level at 1275, and 1288 and 1295-1300 is resistance. The Dow (third chart) has support at 10,960 and 10,900, and resistance is 11,050 and 11,160. Longs bond yields (fourth chart) remain stuck in a tight range.


Recommended for you...

U.S. Needs to Protect Tech Leadership: Qualcomm
Rob Enderle
Apr 8, 2022
HP’s ExtendXR Service Gets an Early Lead on a Looming Metaverse Problem
Rob Enderle
Mar 5, 2022
Cisco’s Purpose Is to Improve the World. Imagine if Others Followed.
Rob Enderle
Dec 17, 2021
HP Builds an Advanced Cloud Workstation for the Metaverse
Rob Enderle
Nov 13, 2021
Internet News Logo

InternetNews is a source of industry news and intelligence for IT professionals from all branches of the technology world. InternetNews focuses on helping professionals grow their knowledge base and authority in their field with the top news and trends in Software, IT Management, Networking & Communications, and Small Business.

Property of TechnologyAdvice. © 2025 TechnologyAdvice. All Rights Reserved

Advertiser Disclosure: Some of the products that appear on this site are from companies from which TechnologyAdvice receives compensation. This compensation may impact how and where products appear on this site including, for example, the order in which they appear. TechnologyAdvice does not include all companies or all types of products available in the marketplace.