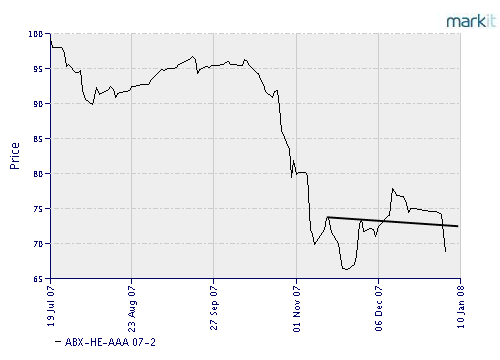
With weakness in November and December continuing into the first week of January, the market continues to look more like 2000-2001 than we’d prefer. The Fed clearly isn’t being aggressive enough to stem the meltdown — witness the hopeful mortgage market charts that are coming unglued here (first chart below, courtesy of Markit.com) — and it remains to be seen whether today’s jobs report was weak enough for the Fed to set aside its inflation concerns.
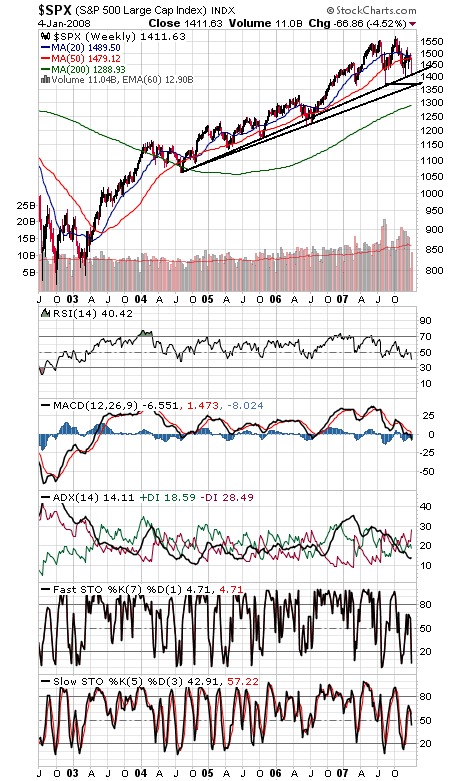
The S&P (second chart) remains at the bottom of its six-month trading range. The index closed at 1406-1407 in August and November; below 1400 and 1360-1370 looks like the last stand for the bulls. 1420 is first resistance.
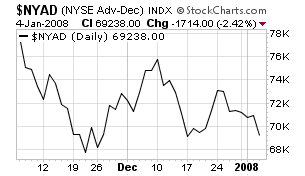
One hopeful note that those support levels might hold: the NYSE advance-decline (third chart) is outperforming here, a sign that selling momentum may be slowing. That said, we don’t like the way commercial traders have been shorting the big S&P 500 contract, a trend we’d like to see reversed quickly.
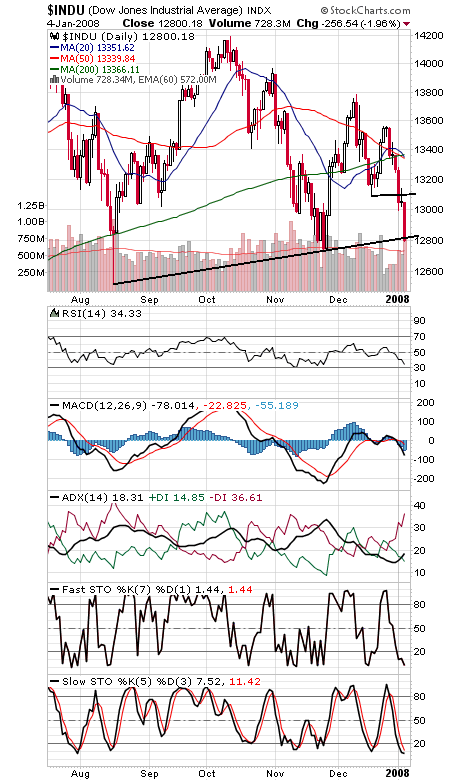
The Dow (fourth chart) needs to hold 12,748 on a closing basis, given the importance of Dow Theory. To the upside, 13,000-13,100 is resistance.
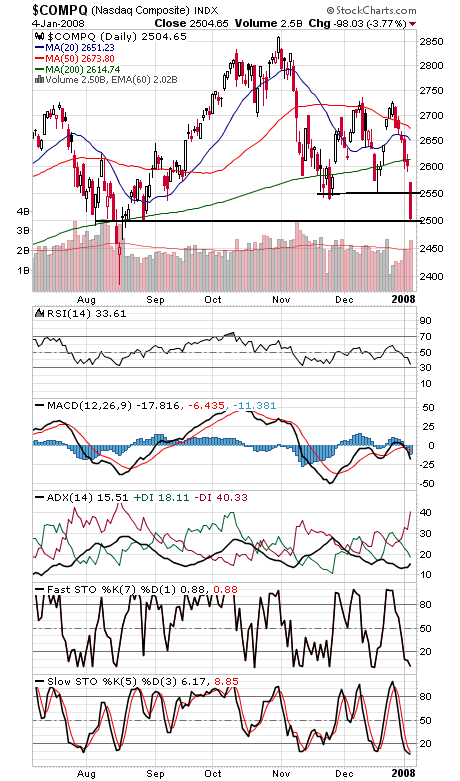
The Nasdaq (fifth chart) needs to hold 2500 or it looks headed for a retest of 2400-2450. First resistance is 2550.
In short, Fed Chairman Ben Bernanke might not like waging a war that should have been fought by his predecessor, but the charts suggest it’s time to act.
And one more note: the high number of 90% volume days on the exchanges since mid-July (today was another) suggests that the SEC’s early July decision to remove restrictions on shorting (the uptick rule) might need to be revisited, or volatility could become the norm.
Paul Shread is a Chartered Market Technician (CMT) and member of the Market Technicians Association.
