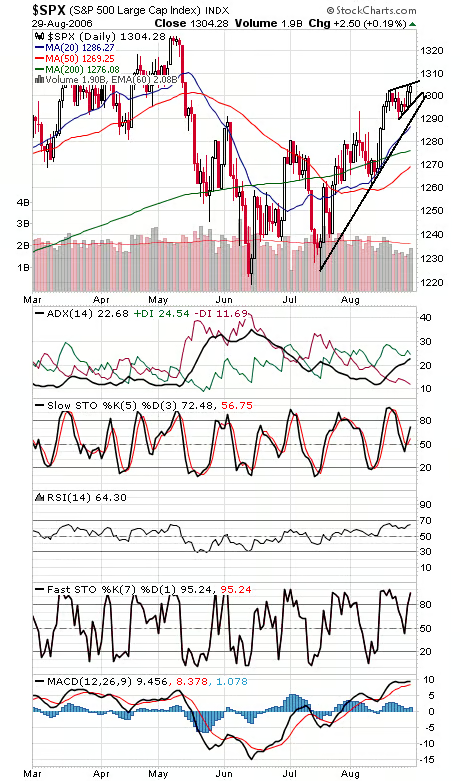
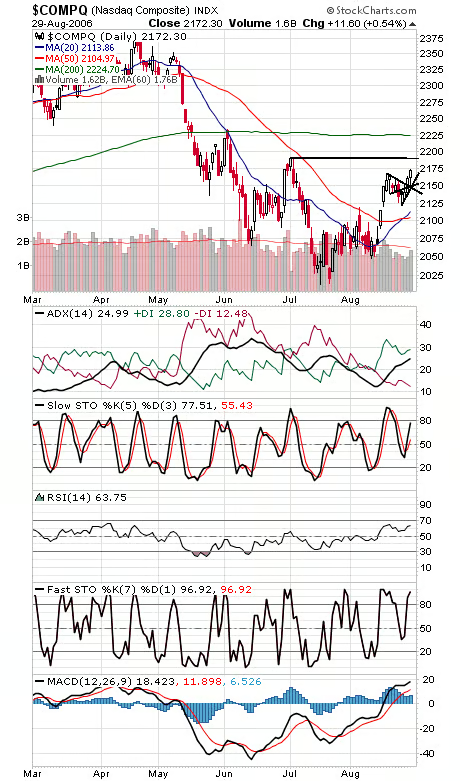
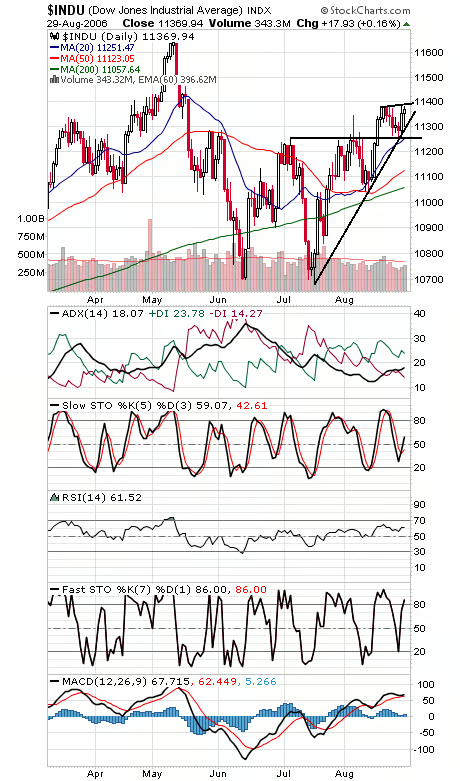
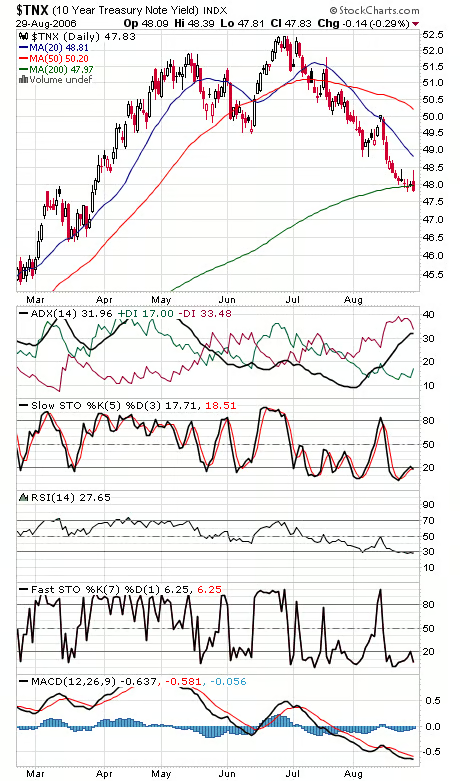
We’ll stick to our view that the S&P (first chart below) is “wedging out” over the last week or so until either the upper or lower trendline breaks. A move above 1306-1307 would be bullish, while a move below 1297 and then 1292 would be bearish. With a lot of economic news coming in the next few days, that move could come soon. Friday will have the added boost of first-of-the-month inflows to accompany the jobs report. Nice job hanging on by the Nasdaq (second chart) today. 2190 is next resistance, and support is 2145-2155. The Dow (third chart) continues to cling to its uptrend line; 11,305 is critical support for tomorrow, with 11,257 below that. 11,395-11,400 and 11,426 are first resistance levels. Bond yields (fourth chart) closed below their 200-day average today, but we’ll stubbornly continue to look for a pullback on several data points that show sentiment getting a little out of hand.