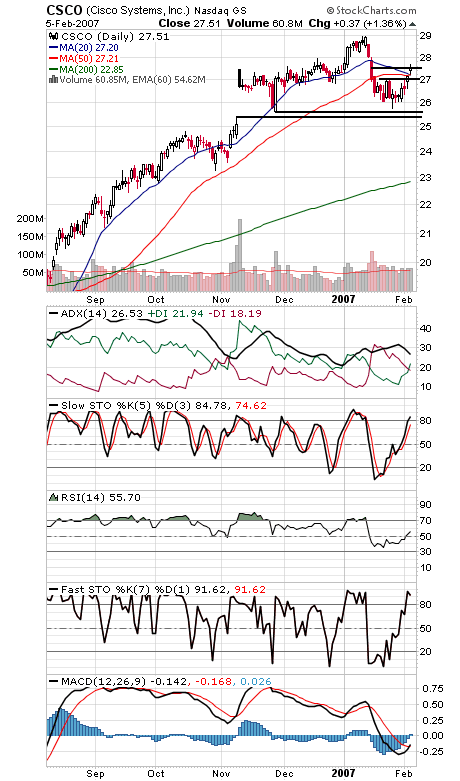
If you’re looking for a reason for the Nasdaq’s recent underperformance, look no further than Cisco (first chart below). After testing a multi-year high last month, the stock fell 11% before recovering half that loss. The 50% retracement level is a common countertrend move, and in this case, it also comes right in the middle of three big red candlesticks from the January decline — bearish “three black crows” in candlestick parlance — so Cisco is truly at a decision point here heading into tomorrow night’s earnings report. It has spent the last few weeks building a base under 27 before breaking out of it last week. A nice short-term uptrend, and with a couple of moving averages at around 27.20, that zone should be solid support heading into tomorrow night’s report. Longer-term, the ability to hold the November bullish gap at 25.50 is another positive, so the bigger trend remains up — with the stock at a critical point right here. A move up on tomorrow night’s report would be a positive, but 28.99-29.39 remains a formidable long-term resistance level.
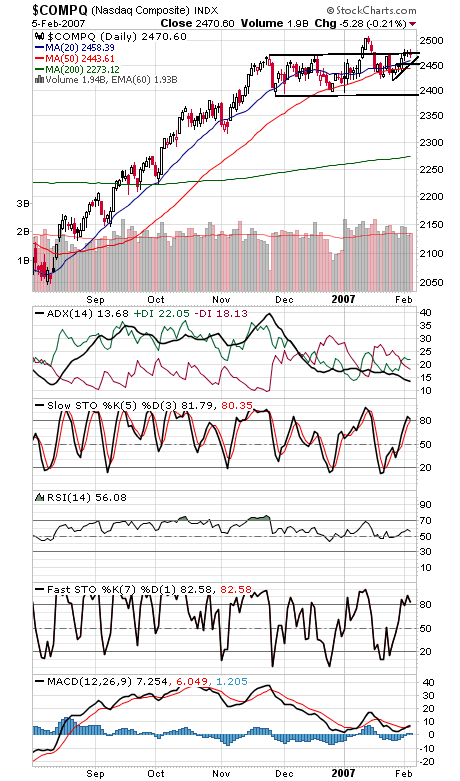
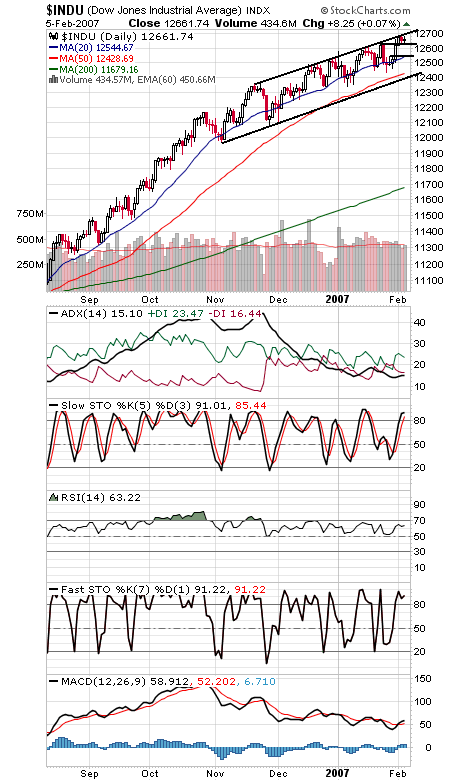
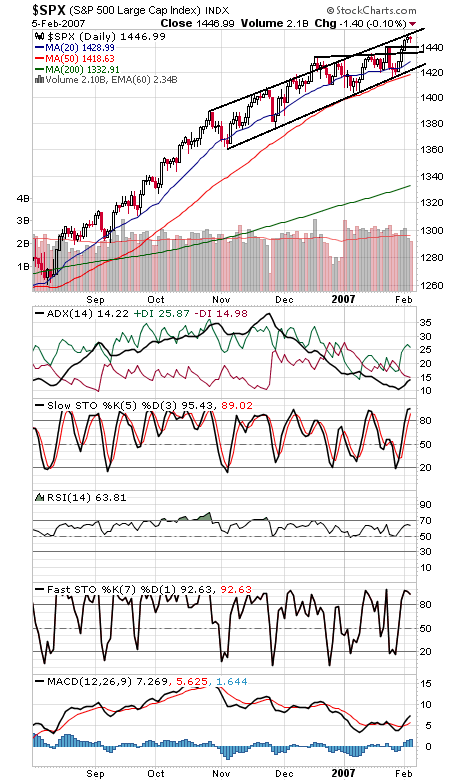
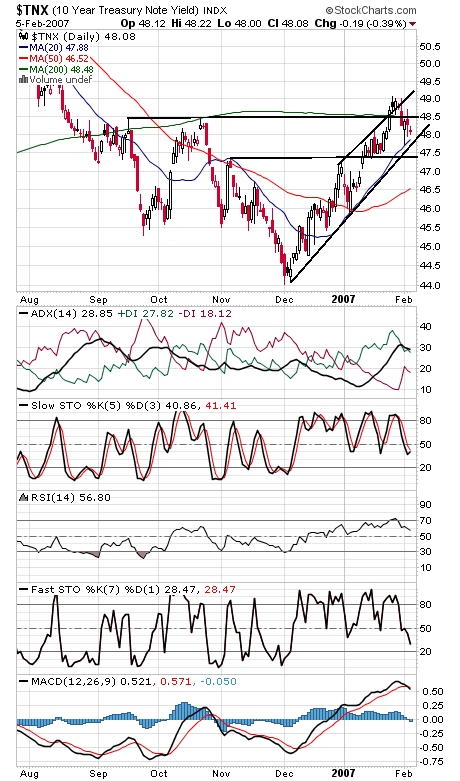
The Nasdaq (second chart) continues to struggle at 2471 resistance — but at least the techs aren’t turning tail here. Support remains 2466 and 2452-2459, and resistance remains 2481 and 2500-2509. The Dow and S&P (third and fourth charts) remain stalled at big levels too, in their case, rising upper channel lines that date back to November. The Dow faces resistance at 12,700, and support is 12,614 and 12,543. The S&P faces resistance at 1450-1452, and support is 1444, 1441 and 1435. The 10-year yield (fifth chart) continues to consolidate within an uptrend.
