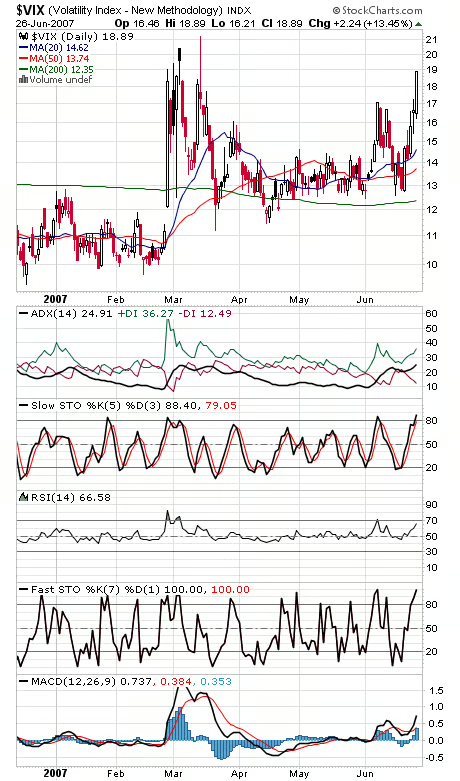
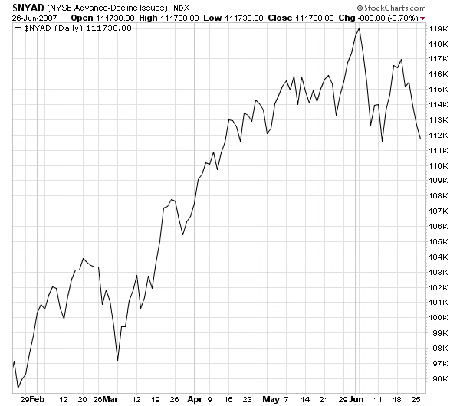
The strangest development today was a big spike in the “fear index,” the options volatility index (first chart below), on a flat day for stocks. That’s a hopeful sign for the bulls, who otherwise remain down and out here, clinging to this month’s lows. But even the NYSE advance-decline line (second chart) is starting to go against them, barely holding above its lows. Perhaps one final washout lower can give the bulls the capitulation they need to turn this thing around. Certainly the failure of the indexes to turn up from support suggests the possibility of more down.
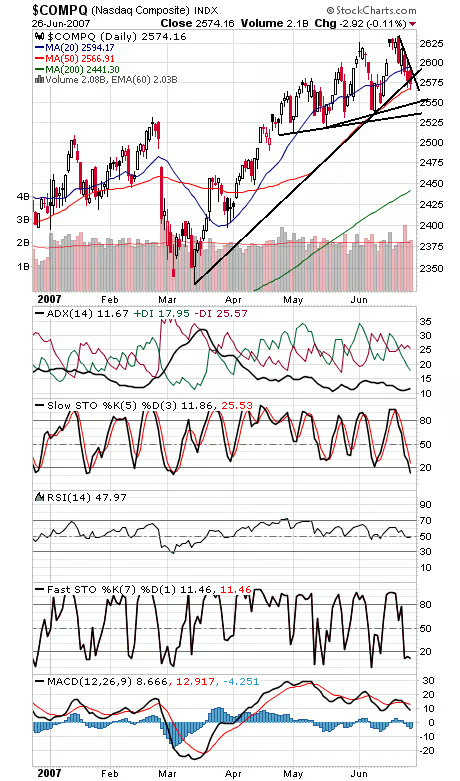
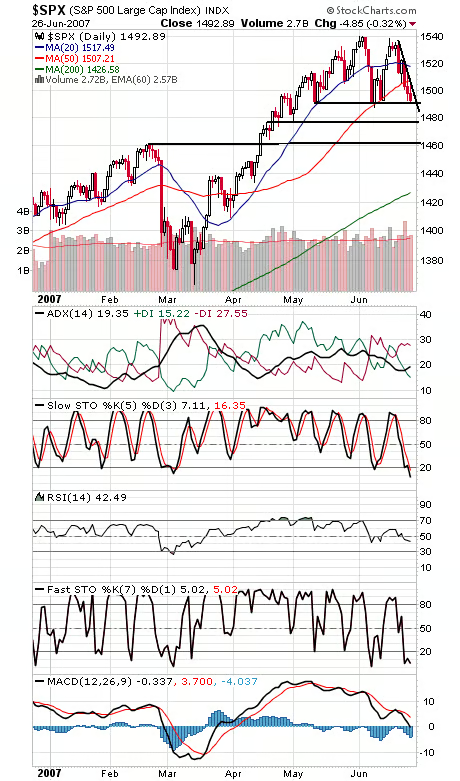
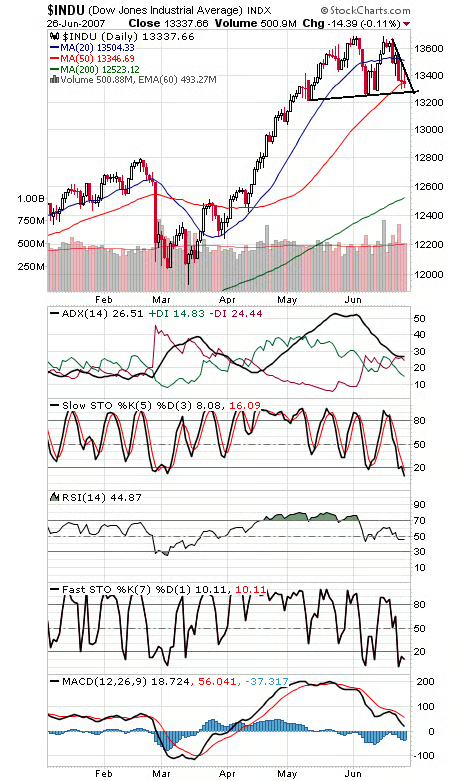
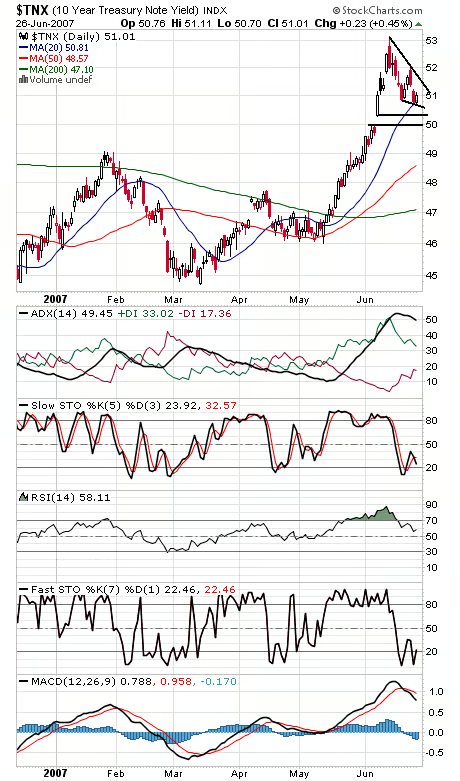
The Nasdaq (third chart) continues to struggle with its 50-day average at 2568. Below that, 2550 and 2535 come into play, and 2583 is first resistance. The S&P (fourth chart) is clinging to 1487-1492 support. If that goes, 1477 comes into view. To the upside, 1495, 1500 and 1507 are resistance. The Dow (fifth chart) has important support at 13,251-13,300, and first resistance is 13,400. The 10-year yield (sixth chart) is running out of downside momentum.
Paul Shread is a Chartered Market Technician (CMT) and member of the Market Technicians Association