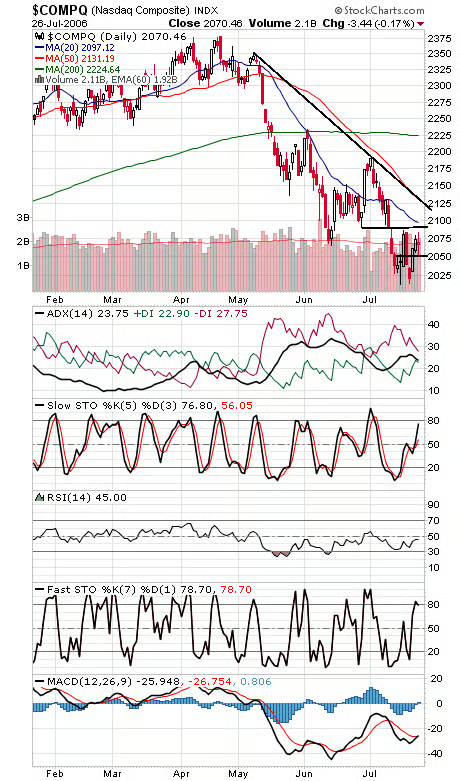
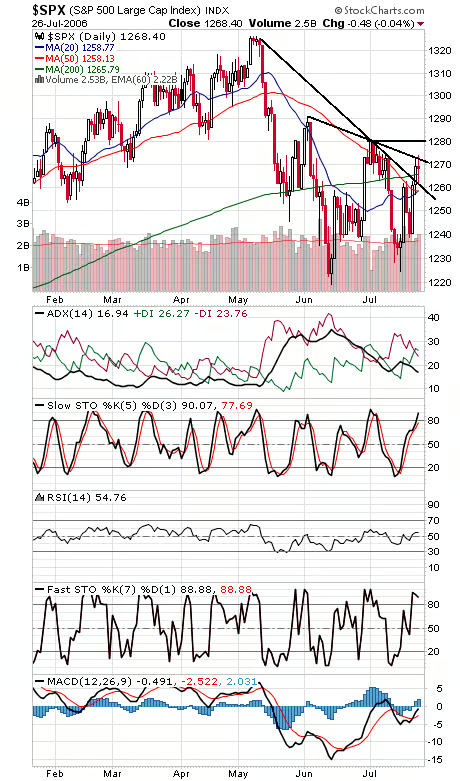
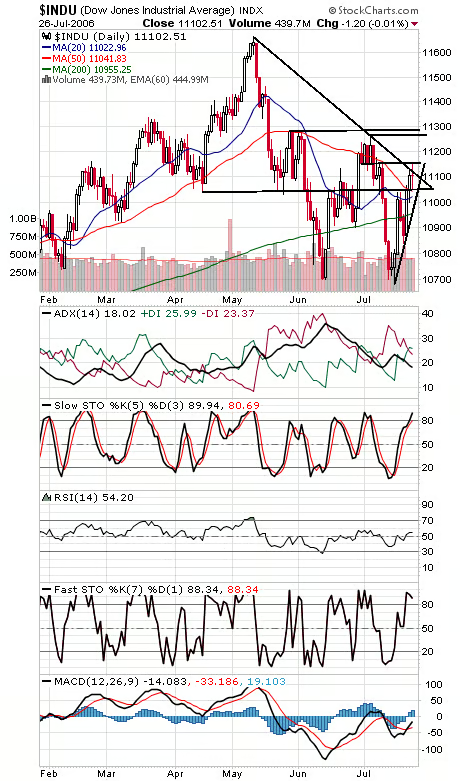
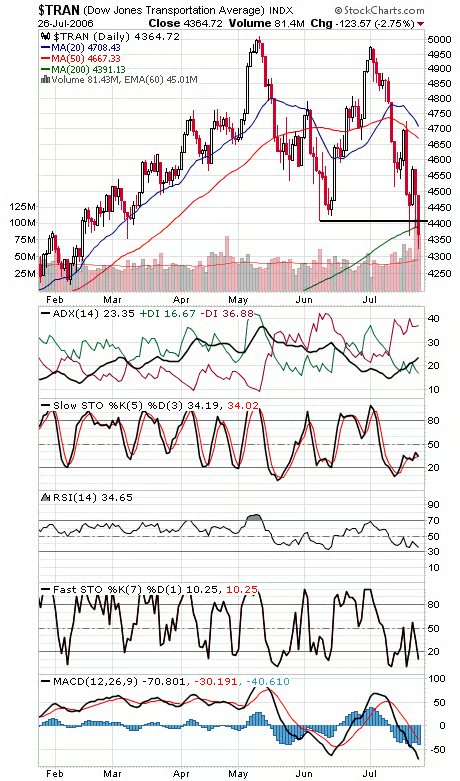
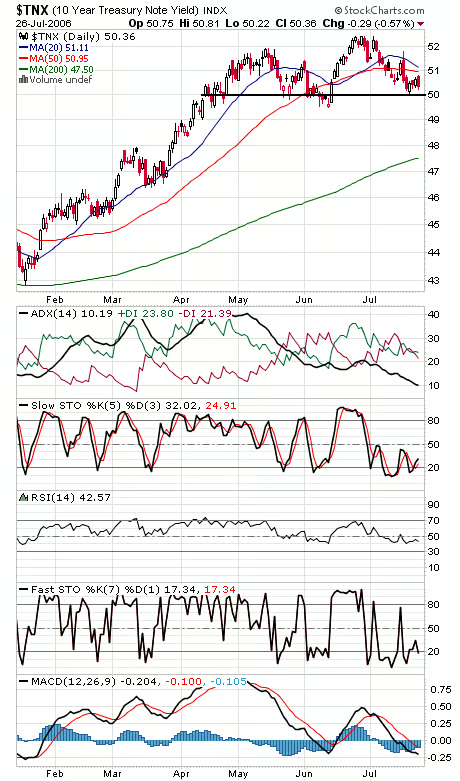
A day full of “dojis,” or indecision candlesticks today. The battle lines look clearest on the Nasdaq (first chart below), which put in a big “outside day” today that eclipsed yesterday’s range — watch 2050 and 2090 for a break there. The S&P (second chart) has support at 1266 and 1260, and resistance at 1275 and 1281. The Dow (third chart) faces resistance at 11,160 and 11,260-11,290, and support is 11,040-11,050, 11,000 and 10,960. Important for Dow Theory is the new intermediate term low in the Transports (fourth chart today); as long as the Dow remains above 10,700, that’s not a major problem yet, in our view. Long bond yields (fourth chart) continue to coil above the important 5% level.