SHARE
Facebook X Pinterest WhatsApp

Technical Analysis: Downtrend Resumes

Written By
thumbnail
Paul Shread
Paul Shread
Jul 13, 2006

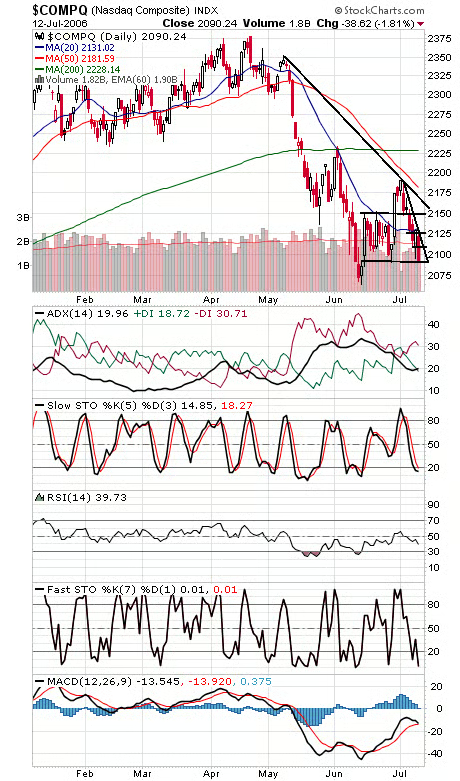
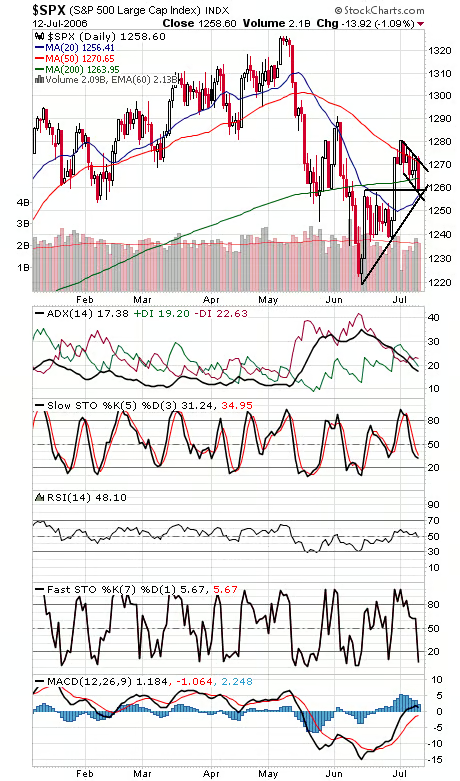
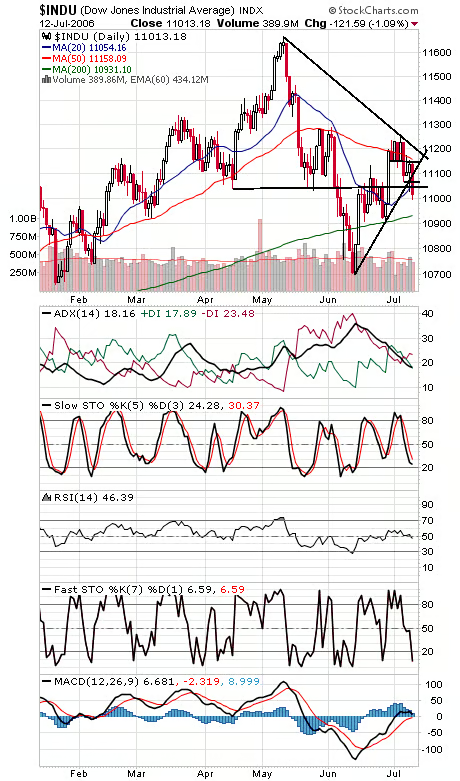
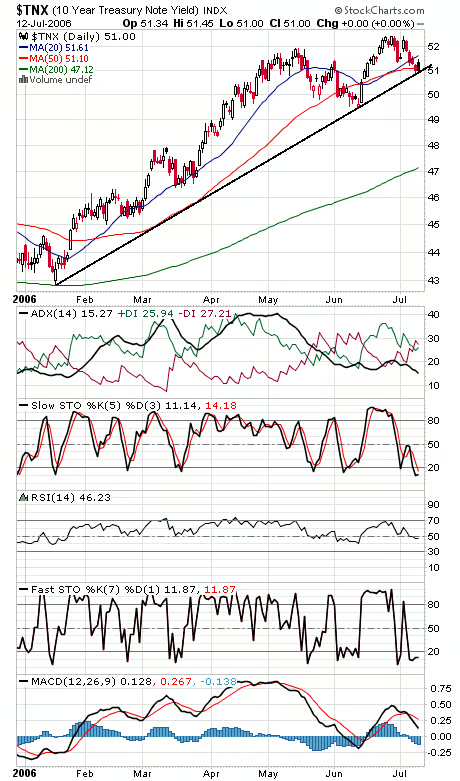
The Nasdaq (first chart below) continues to cling to 2090 support, with 2065 below that. To the upside, resistance levels are 2110-2115, 2125 and 2150. The S&P (second chart) is the most constructive chart here, with support at 2155-2157 and resistance at 1264 and 1270. The Dow (third chart) is clinging to 11,000, with 10,935 below that. Resistance is 11,030-11,040, 11,066, 11,120 and 11,150. Long bond yields (fourth chart) are another index barely hanging on.


Recommended for you...

U.S. Needs to Protect Tech Leadership: Qualcomm
Rob Enderle
Apr 8, 2022
HP’s ExtendXR Service Gets an Early Lead on a Looming Metaverse Problem
Rob Enderle
Mar 5, 2022
Cisco’s Purpose Is to Improve the World. Imagine if Others Followed.
Rob Enderle
Dec 17, 2021
HP Builds an Advanced Cloud Workstation for the Metaverse
Rob Enderle
Nov 13, 2021
Internet News Logo

InternetNews is a source of industry news and intelligence for IT professionals from all branches of the technology world. InternetNews focuses on helping professionals grow their knowledge base and authority in their field with the top news and trends in Software, IT Management, Networking & Communications, and Small Business.

Property of TechnologyAdvice. © 2025 TechnologyAdvice. All Rights Reserved

Advertiser Disclosure: Some of the products that appear on this site are from companies from which TechnologyAdvice receives compensation. This compensation may impact how and where products appear on this site including, for example, the order in which they appear. TechnologyAdvice does not include all companies or all types of products available in the marketplace.