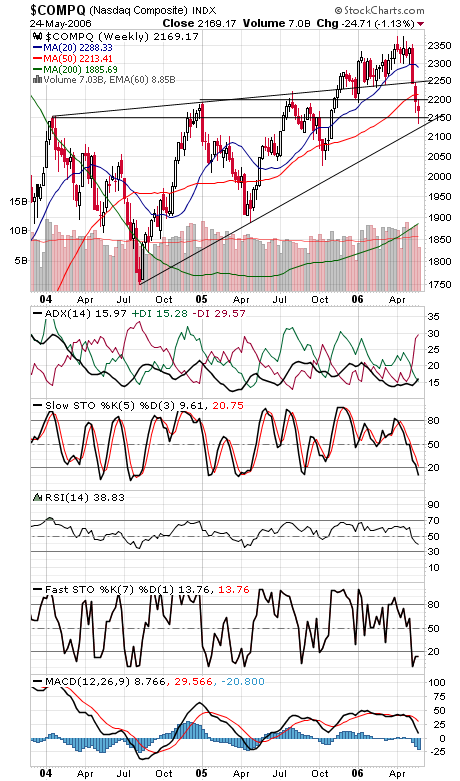
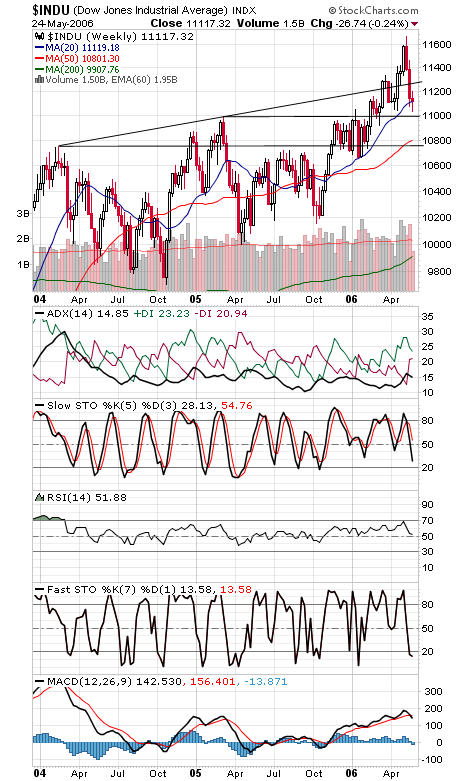
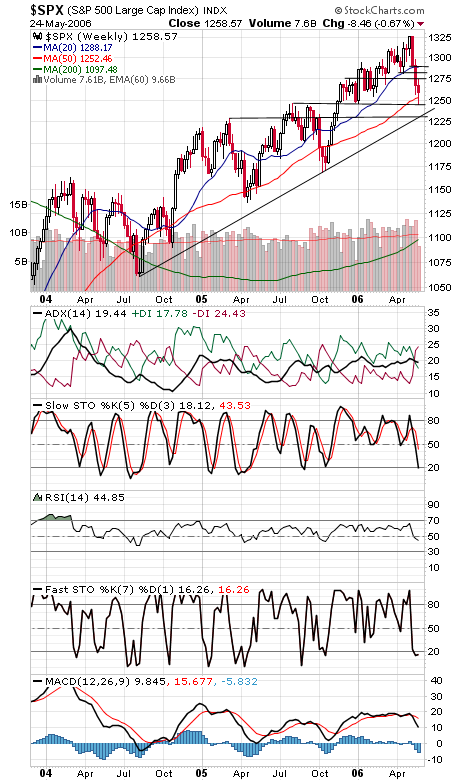
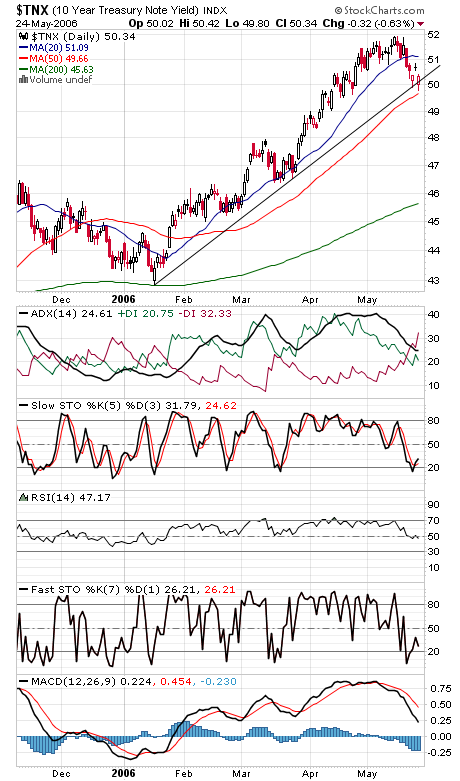
The question on everyone’s mind, of course, is whether stocks have had enough of a washout for a good bounce. Certainly options traders are showing some healthy fear, and the indexes are all pretty oversold and at some major support levels. But stocks are in the weakest part of the year in the weakest part of the presidential cycle with a new Federal Reserve chairman at the helm, so there are a number of headwinds over the next five months. The Nasdaq (first chart below) broke important support at 2150 today, coming within 10 points of the next critical level at 2125, before recovering. Resistance is 2180, 2200, 2211, 2220, 2229 and 2245-2250. Looking at the weekly chart, 11,000 is an important level on the Dow (second chart); below that, 10,750-10,800 could come into play. Resistance is 11,200, 11,225, 11,250, 11,280 and 11,330. The S&P (third chart) barely held major support at 1246-1253 today; 1230 comes into play if that support zone fails. Resistance is 1275, 1282-1284 and 1288-1290. Long bond yields (fourth chart) have become as volatile as stocks. Much lower on yields and bond traders might be sensing a slowdown.


