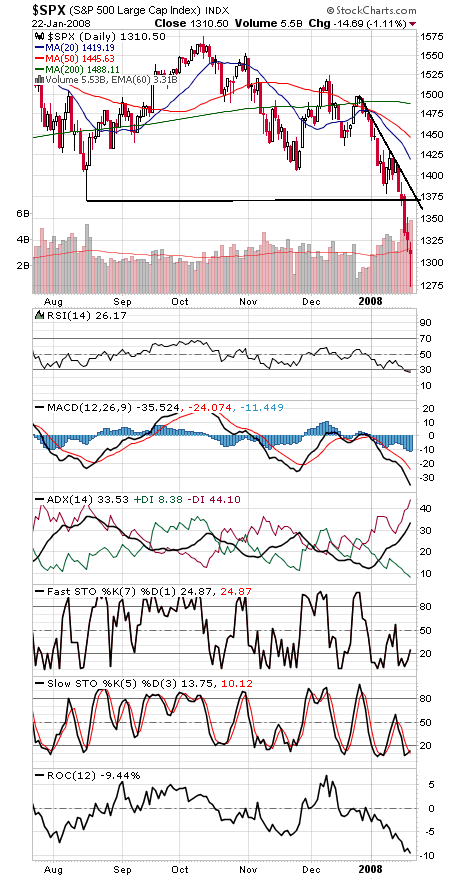
The market finally got the interest rate cut it was looking for today, but did it come too late? A half-point rate cut a week ago, when the S&P 500 (first chart below) was still above 1370, would have been better than a three-quarter-point cut after the breakdown, but there are nonetheless some positives here for the market to build on.
For starters, sentiment indexes like ISEE are showing a lot of bearishness, while commercial futures traders are buying. And check out today’s big spike in the VIX (chart two, the options volatility index).
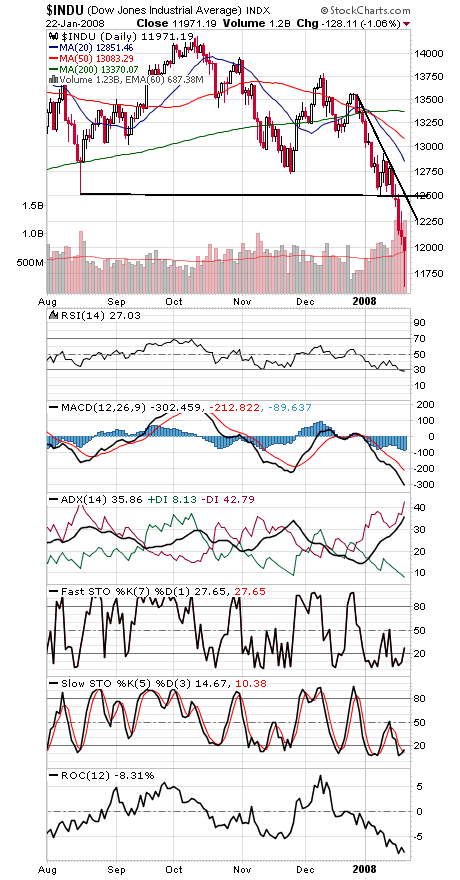
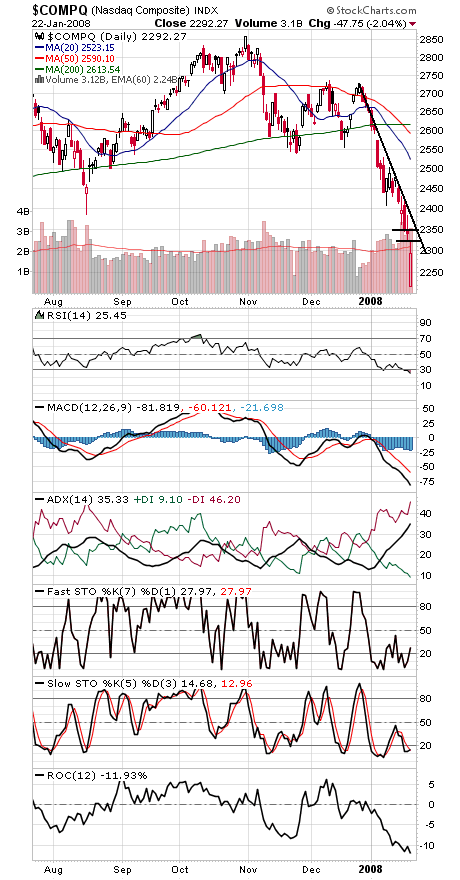
But more importantly, at today’s lows, the indexes were as oversold as they were during the Asian currency crisis of 1997-1998 (see the ROC indicator at the bottom of the charts below). A weekly close about 1% lower from here would be even better, but the indexes are nonetheless pretty extended. They’ve only been more oversold three times in the last 20 years than they were at their lows today: October 1987, September 2001 and July 2002. Let’s hope they don’t have to get that stretched before they snap back.
Beyond that, we’d like to see positive divergences in momentum (ROC again) and new highs and lows stabilize for the market to begin to form a bottom.
The S&P needs to get back above 1322, 1350 and 1364-1370 to reassert the bullish case. To the downside, 1280-1290 and 1274 are first supports.
The Dow (third chart) barely held onto 11,750 today, its 2000 peak, getting as low as 11,635 before rebounding. To the upside, 12,092, 12,340 and 12,500 are the first hurdles for the blue chips.
The Nasdaq (fourth chart) opened on its lows at 2221 today and managed to finish 70 points higher. 2250 is first support, and 2318-2323 is first resistance, with 2350 and 2387 above that.
Paul Shread is a Chartered Market Technician (CMT) and member of the Market Technicians Association.


