Technical Analysis: Hanging Around Support | Internet News

Technical Analysis: Hanging Around Support

Written By
Paul Shread
Paul Shread
Mar 28, 2007
1 minute read

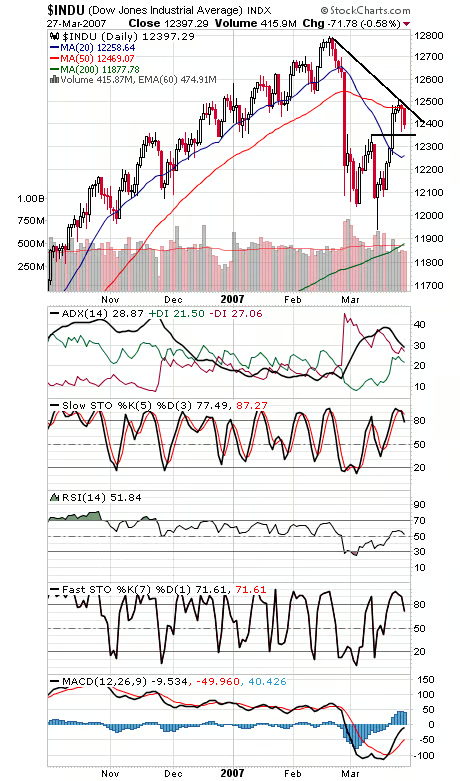
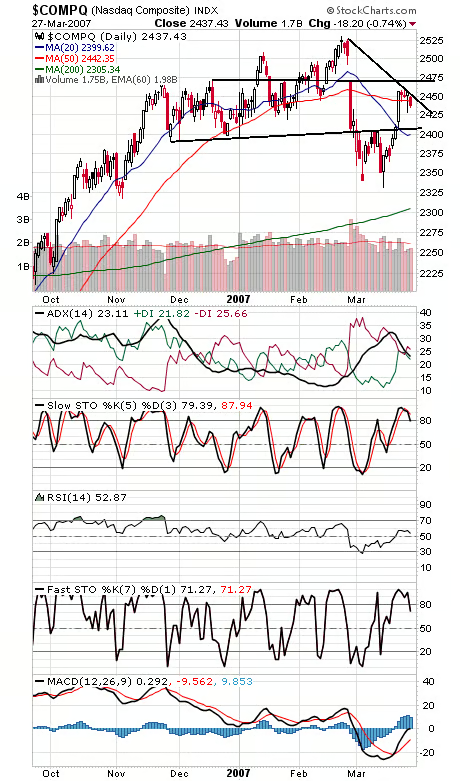
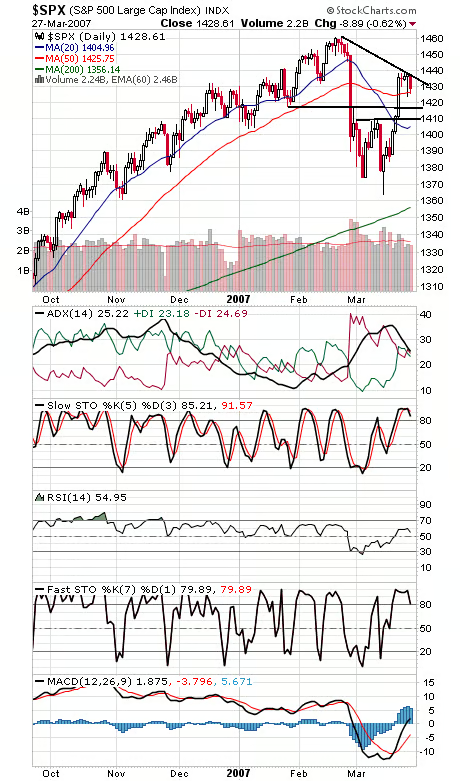
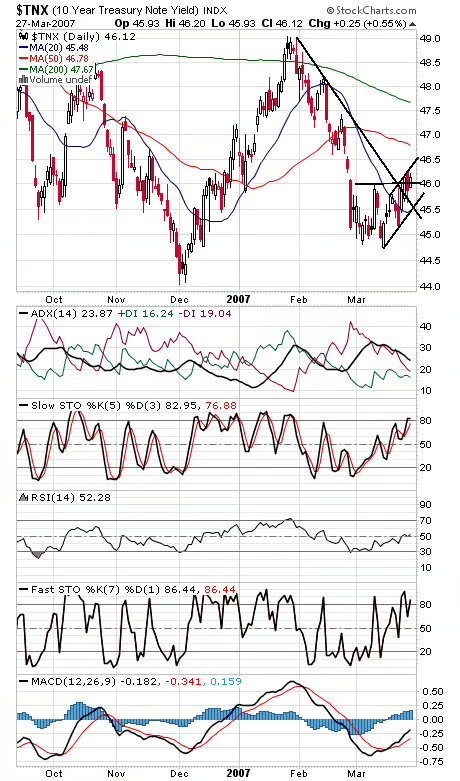
The Dow (first chart below) remains perilously close to 12,350 support here. On the plus side, in another day or two we’ll have monthly inflows and quarterly window dressing to support the market, so the market is likely doing little more than consolidating its gains here. To the upside, 12,469, 12,511, 12,550 and 12,620 are resistance. The Nasdaq (second chart) is holding up very well, a good sign for the market in general. Support is 2425 and 2407, and resistance is 2442, 2450, 2460 and 2471. The S&P (third chart) is barely hanging onto its 50-day average. Next levels down are 1416-1418 and 1410, and resistance is 1435 and 1440. Bond yields (fourth chart) are pointed up in the near-term, but not convincingly so, as they remain in a narrow, choppy channel.


Internet News Logo

InternetNews is a source of industry news and intelligence for IT professionals from all branches of the technology world. InternetNews focuses on helping professionals grow their knowledge base and authority in their field with the top news and trends in Software, IT Management, Networking & Communications, and Small Business.

Property of TechnologyAdvice. © 2026 TechnologyAdvice. All Rights Reserved

Advertiser Disclosure: Some of the products that appear on this site are from companies from which TechnologyAdvice receives compensation. This compensation may impact how and where products appear on this site including, for example, the order in which they appear. TechnologyAdvice does not include all companies or all types of products available in the marketplace.