Stocks are sure having a rough time trying to right themselves. As we’ve noted ad nauseum, sentiment indicators support a bottom here, but price has yet to agree. And price has the final say.
Still, we’ll note one positive development this week: the Investors Intelligence weekly sentiment survey came in with numbers this that showed the most bearish sentiment since the October 2002 bottom.
At 31.1-43.6 bulls-bears, it’s the lowest reading since there were 28.4% bulls and 43.2% bears at the 2002 low. It could still get worse, but at the first sign the world isn’t going to come to an end, we could get a heck of a rally. There are plenty of shorts out there to fuel it.
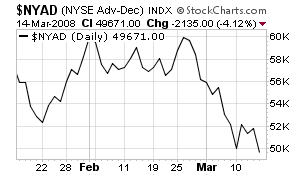
One potentially positive technical development today was the failure of the major indexes to make new lows despite news of the implosion of Bear Stearns. Still, the NYSE advance-decline line (first chart below) made a new low, which is a negative since the broad list tends to lead the market.
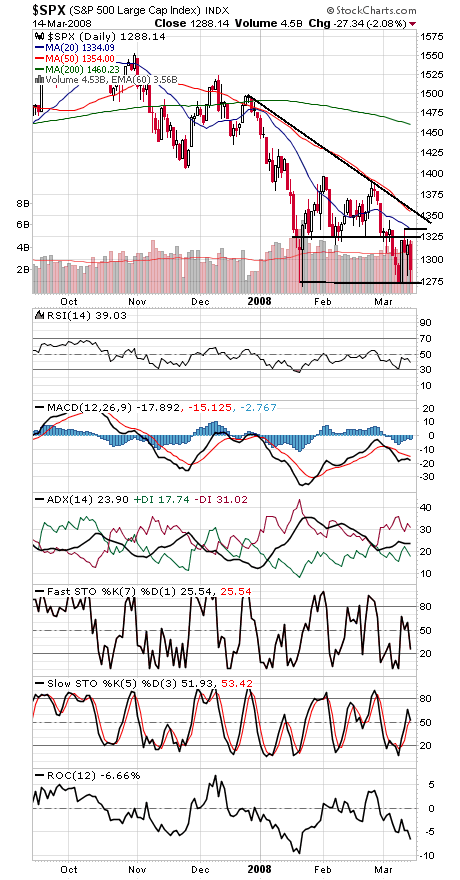
The S&P 500 (second chart) has major support at 1270, with 1250 and 1219-1225 below that. Resistance is 1325-1335 and 1350.
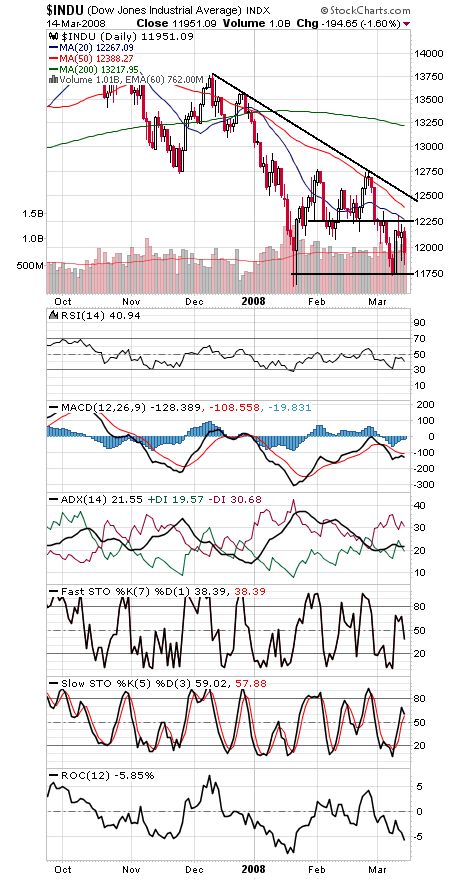
The Dow (third chart) has major support at 11,750 and 11,635-11,670, with 11,400-11,500 and 11,250 below that. First resistance is 12,250-12,300.
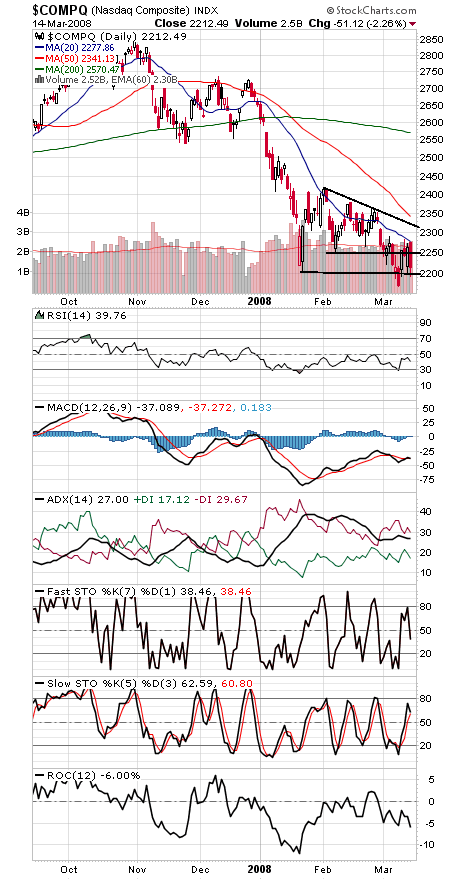
The Nasdaq (third chart) has support at 2168 and 2100-2120. Resistance is 2250-2275.
Paul Shread is a Chartered Market Technician (CMT) and member of the Market Technicians Association.


