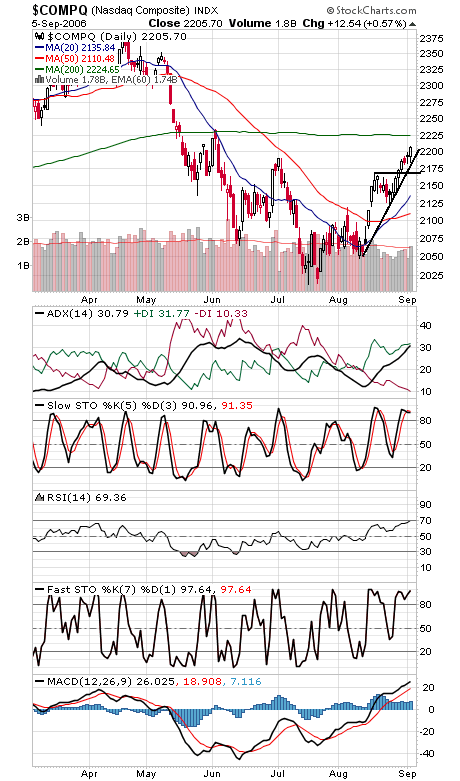
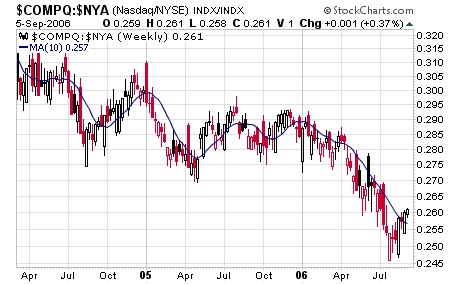
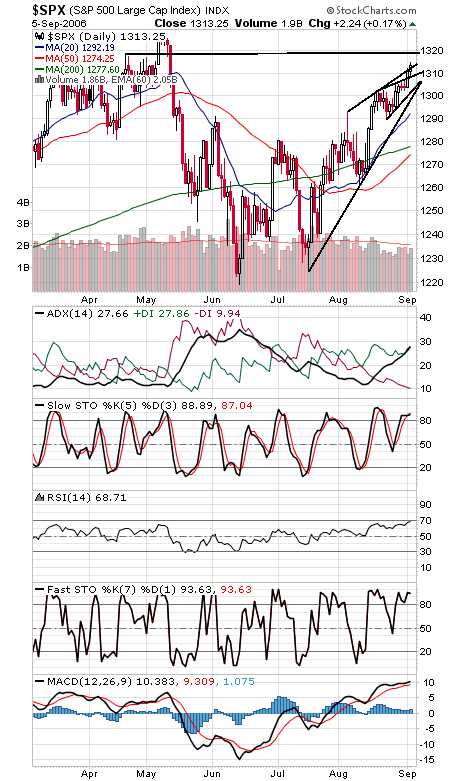
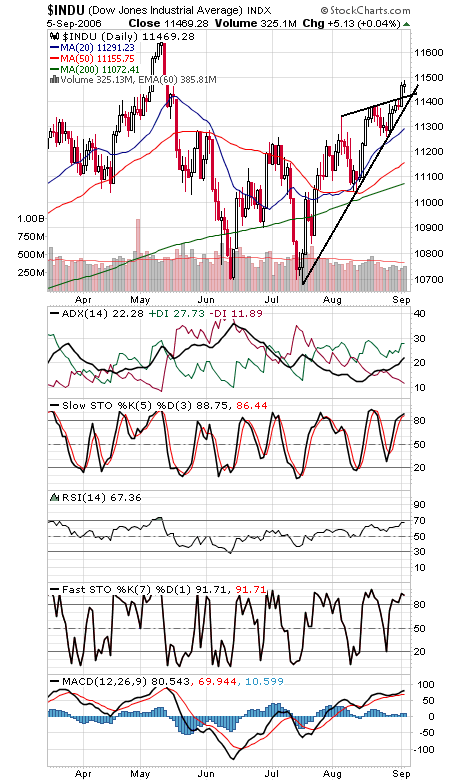
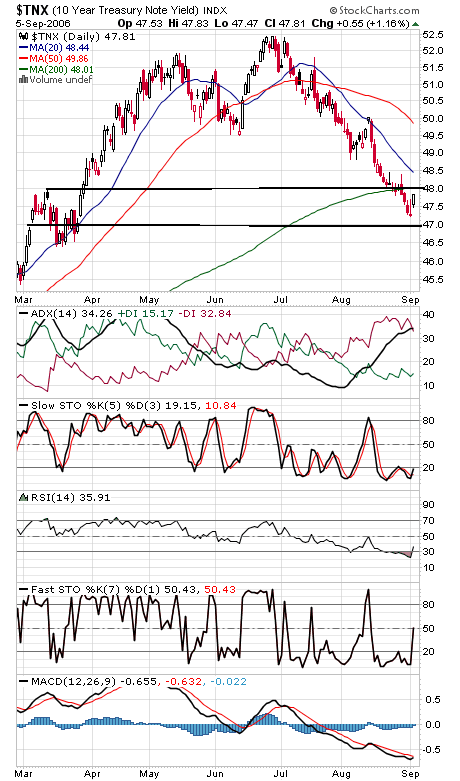
Solid breakouts on the indexes the last couple of days, but can they hold up in what has historically been the weakest month of the year for stocks? In general, price action remains resilient (although internals weakened somewhat the last two days), sentiment remains positive for stocks, and even commercial futures traders are starting to come around. The one weakness remains seasonality and cycles, but they too will begin to turn positive in another month. The Nasdaq (first chart below) is coming up on its 200-day average at 2225, and 2240 is an equally tough level above that. That said, the index finally registered a buy signal under Gerald Appel’s relative strength system on Friday (second chart); an intriguing time of year for tech stocks to be taking the lead, a positive sign for the broader market about 70% of the time. 2185 is critical support. The S&P (third chart) has taken out two rising resistance lines in the last couple of days — impressive strength there. Resistance levels are 1315, 1319 and 1327, and support is 1309 and 1300-1304. The Dow (fourth chart) has also blasted through rising resistance. Next resistance levels are 11,500 and 11,670, and 11,400-11,420 is critical support. Bond yields (fifth chart) never quite tested 4.7% support, but they still need to take out 4.8% to turn higher.
