Technical Analysis: Indexes Test Big Levels | Internet News

Technical Analysis: Indexes Test Big Levels

Written By
Paul Shread
Paul Shread
Jan 7, 2006
1 minute read


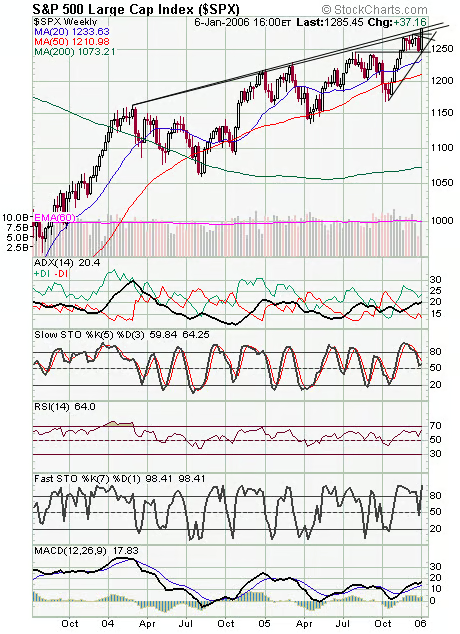
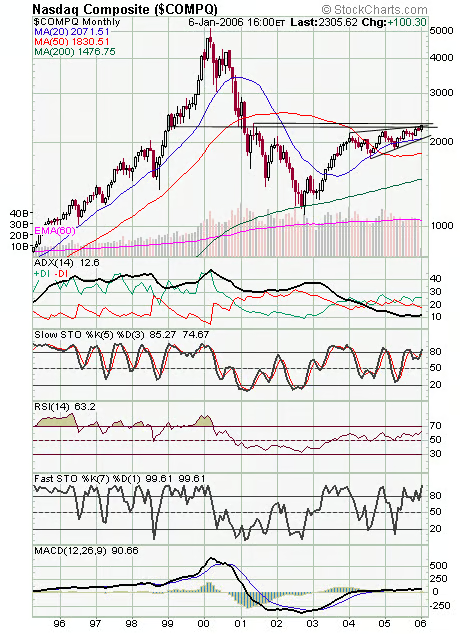
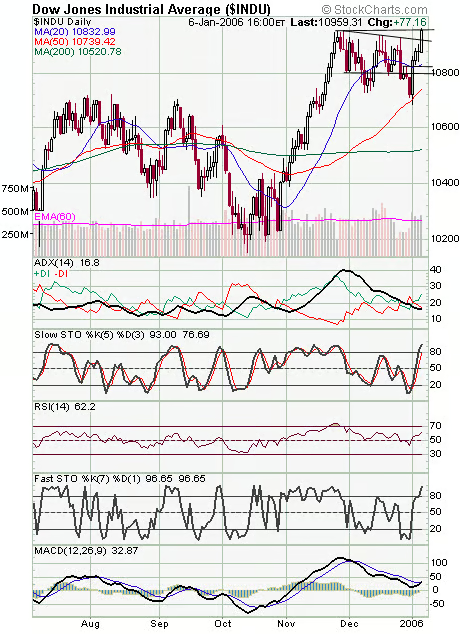
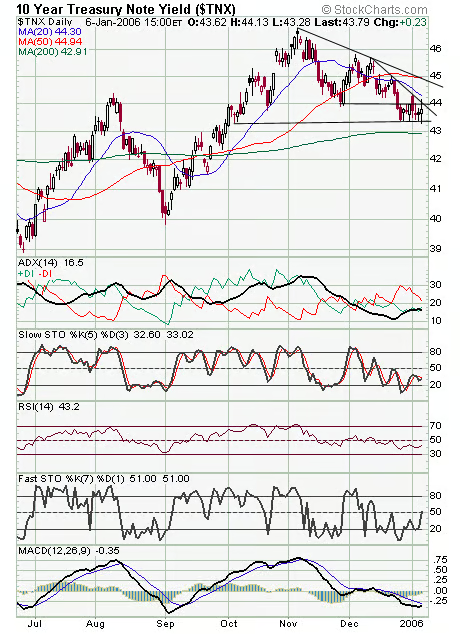
The major indexes are all pushing some very big levels here, starting with the S&P (first chart below) which is pushing the very top of a two-year resistance line at about 1285; that line should be a few points higher next week. Above that, 1300 and 1316 are the next big levels. To the downside, 1275, 1268-1270, 1260 and 1246-1250 are support. Next up for the Nasdaq (second chart) is its May 2001 peak of 2328, and support is 2290 and 2278-2280. The Dow (third chart) is once again pushing 11,000; can it finally clear that big round number? Support is 10,875-10,920 and 10,800-10,840. Long bonds (fourth chart) weren’t too happy about today’s bigger than expected wage gains. Also, we’d note that commercial traders continue to short the big S&P contract; they’re often early, but rarely wrong.


Internet News Logo

InternetNews is a source of industry news and intelligence for IT professionals from all branches of the technology world. InternetNews focuses on helping professionals grow their knowledge base and authority in their field with the top news and trends in Software, IT Management, Networking & Communications, and Small Business.

Property of TechnologyAdvice. © 2026 TechnologyAdvice. All Rights Reserved

Advertiser Disclosure: Some of the products that appear on this site are from companies from which TechnologyAdvice receives compensation. This compensation may impact how and where products appear on this site including, for example, the order in which they appear. TechnologyAdvice does not include all companies or all types of products available in the marketplace.