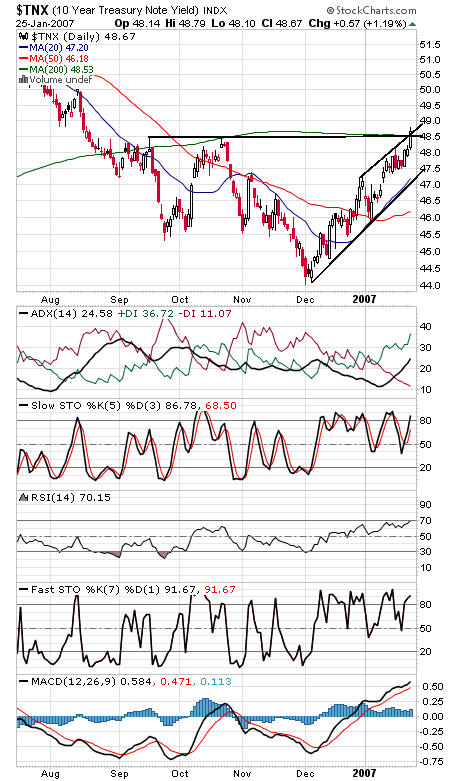
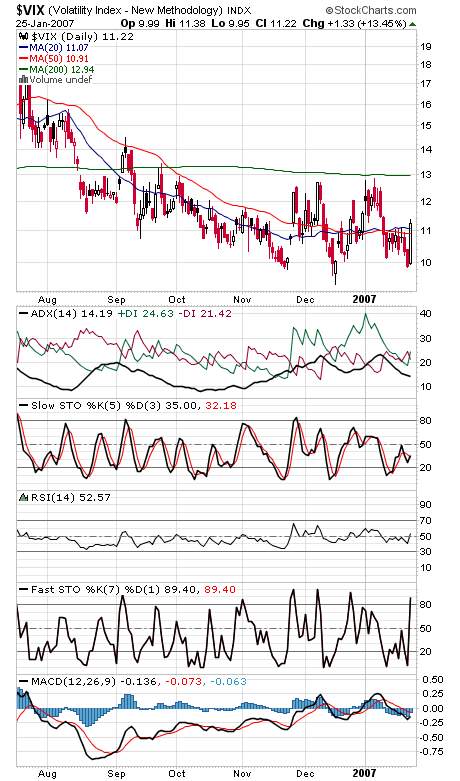
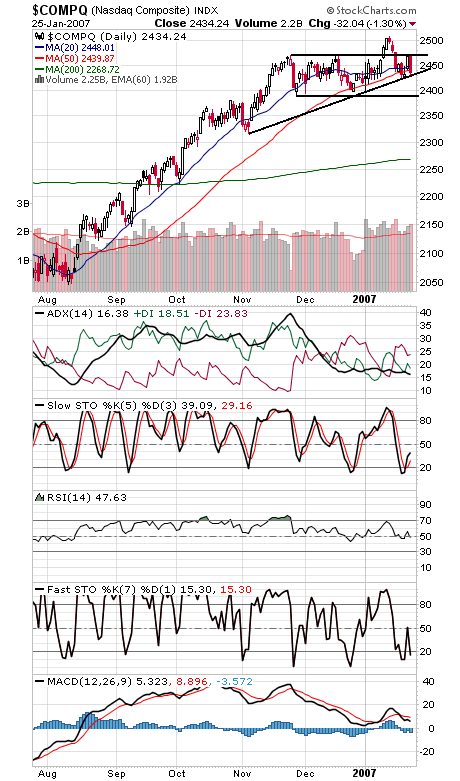
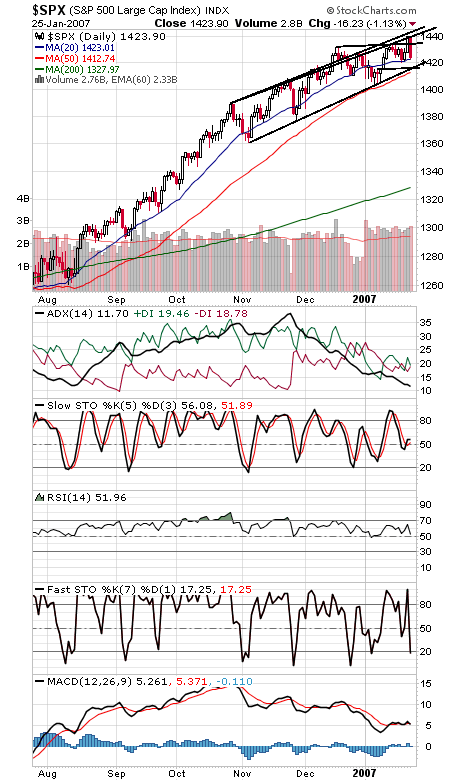
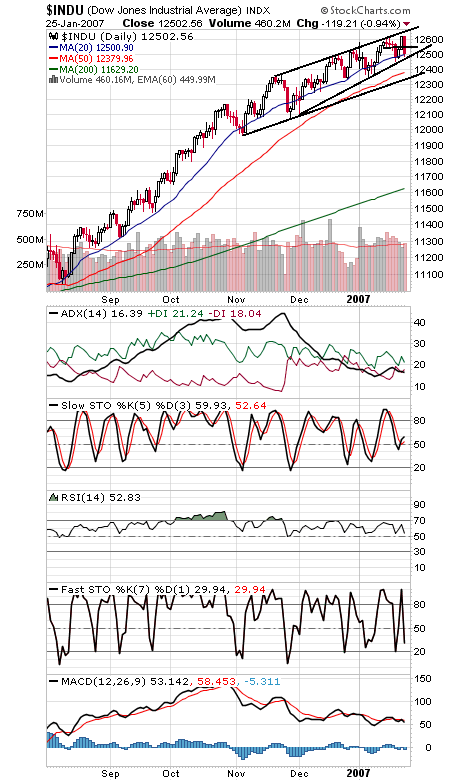
The bond market (first chart below) was behind today’s sell-off, as yields shot above the 200-day moving average and hit their highest level since August. Still, yields are getting a little extended on all indicators, so they may be due for a breather. If not, they could continue to give investors reason to worry. That said, steep declines seldom start straight off a top, and it’s been some time since sellers have been able to string together multiple down days. Add a 13% jump in the VIX (second chart) to the mix, and bulls have everything they need to turn the market up again, perhaps in time for an end of the month rally. That said, the Nasdaq (third chart) needs to regain the 2471 level or it could begin to look toppy. And much lower than 2430 and the index could lose its uptrend line from early November. 2390-2400 is critical support for the techs. The S&P’s (fourth chart) upper trendline turned out to be stronger than we thought. 1435, 1441 and 1445 are resistance, and 1413-1417 is important support. The Dow (fifth chart) is another index sitting right on an uptrend line. Below 12,480 and 12,380-12,400 could come into play. 12,550 is first resistance.