The market gave up a very big trading range today on near-record volume, yet another breakdown in the most brutal bear market in 70 years.
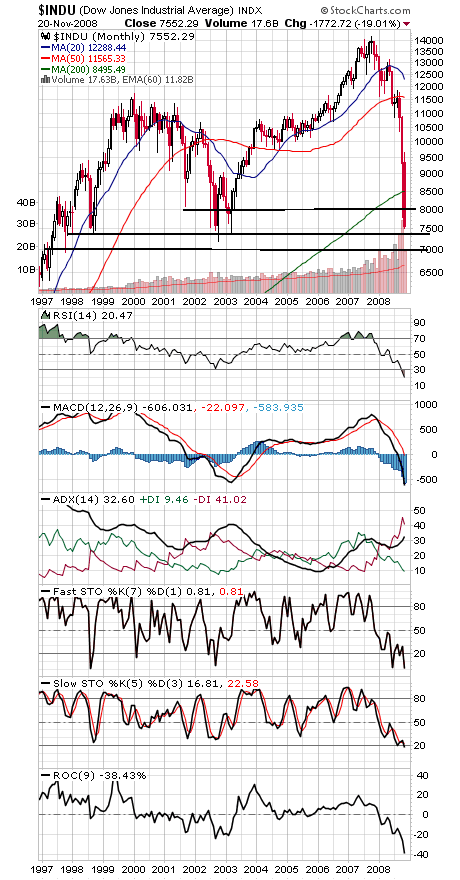
It now falls to the Dow (first chart below) to keep this market from hitting much lower levels.
The Dow should have strong support between here and 7000, which would cover the 1998 and 2002-2003 lows (7200-7400), the 50% decline mark (7100) and the October 1997 low (6971). A very important place for the market to make a stand.
We would also note that at -38.4%, the 9-month ROC is now at its most oversold level since it hit -40% at the 1938 low. It’s worth noting that the SEC implemented the uptick rule in 1938 in response to the 1937-1938 decline, just one more piece of evidence that the SEC needs to revisit its ill-timed decision to revoke the rule in July 2007, and sooner rather than later.
To the upside, a move back above 7900-8000 would be a good start for the bulls.
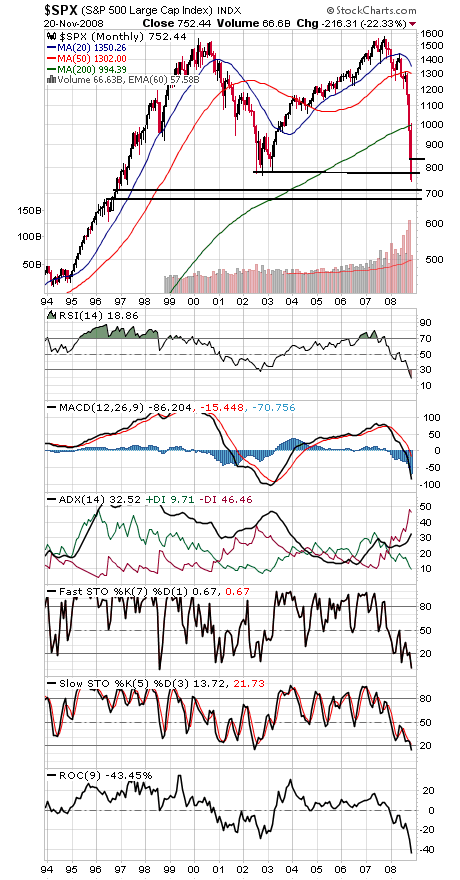
The S&P (second chart) lost major support today; the next possible support levels are 733, 716 and 681. To the upside, the index needs to get back above 768-789 and 818-840 to make a bare beginning.
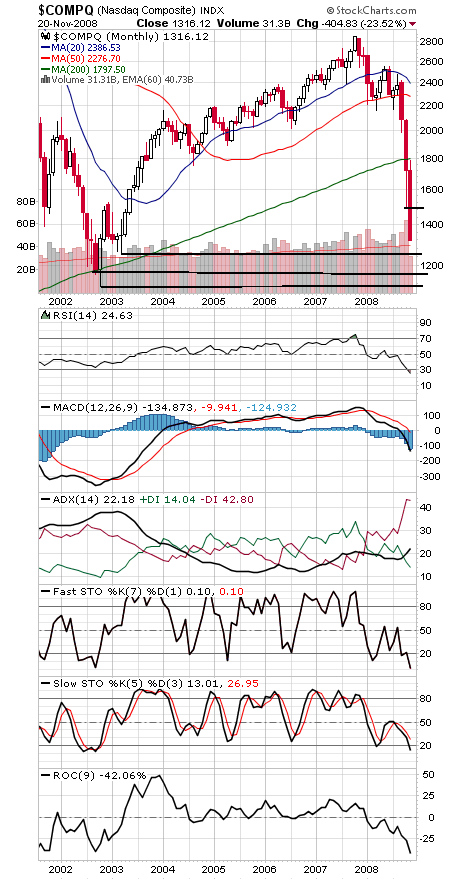
The next support levels for the Nasdaq (third chart) are 1253, 1160-1180 and 1108, while a move above 1430 and 1493 would be a good start for the bullish case.
We had warned repeatedly that a break of the 2006 low of 10,683 on the Dow could mean a full-fledged systemic crisis, but the speed with which events have since unfolded has been nothing short of shocking.
Paul Shread is a Chartered Market Technician (CMT) and member of the Market Technicians Association.


