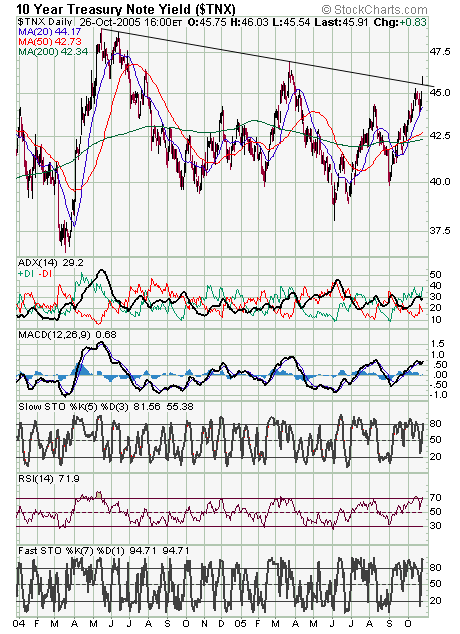
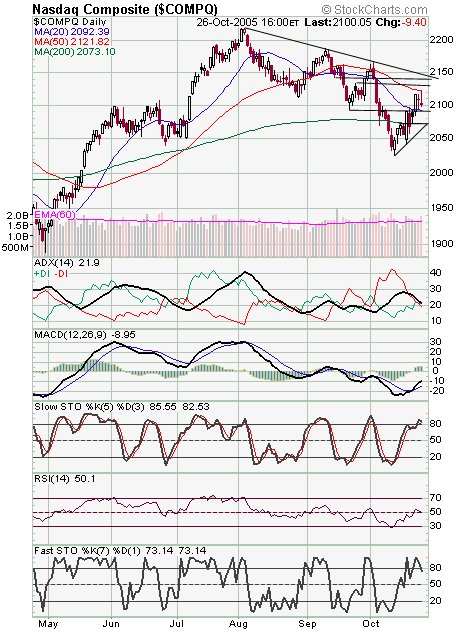
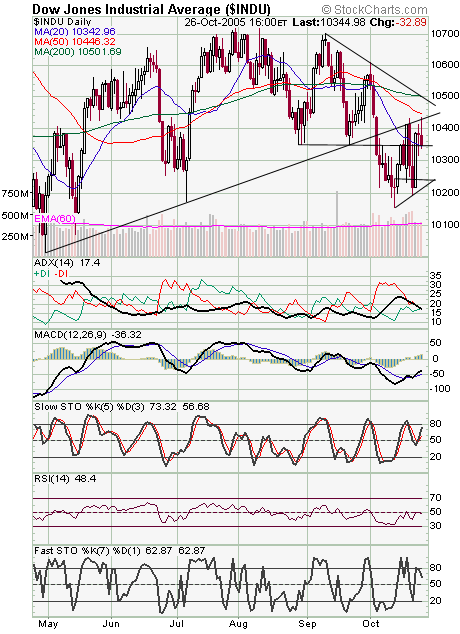
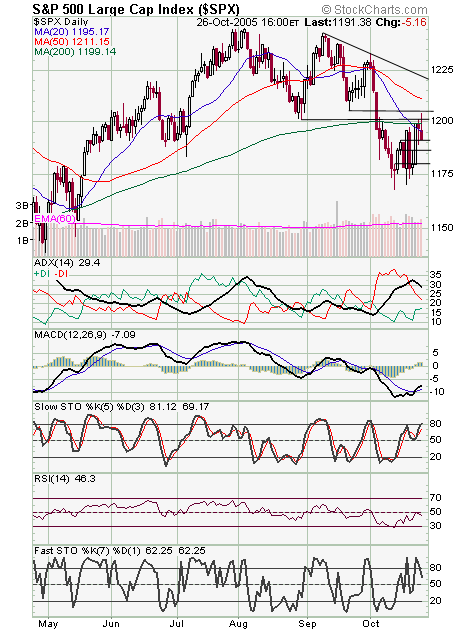
A big breakout in treasury yields (first chart below) is not the best of signs for equity investors. The best thing for stock market bulls right now would be to see the 10-year yield back below 4.55. The Nasdaq (second chart) has resistance at 2122, 2130 and 2140-2148, and support is 2090-2093 and 2073. The Dow and S&P (third and fourth charts) also ran into resistance today. Support on the Dow is 10,317, 10,300 and 10,240, and resistance is 10,435-10,445 and 10,500. The S&P has support at 1189, 1187 and 1180, and resistance remains 1199-1201 and 1205.


