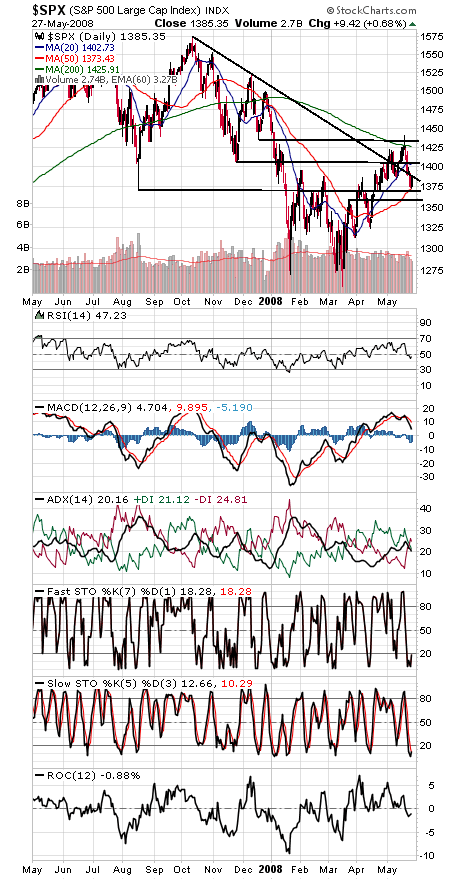
The major indexes are struggling to form a bottom here, with the S&P (first chart below) trying to lead the way. 1370-1373 looks like pretty good support on the index, covering both its 50-day average and last August’s low. A good place for the bulls to make a stand — and they have end of the month inflows to support them for the next several days.
If 1370 goes, 1360 is the next support level for the big caps. To the upside, 1400-1406 would be a good start.
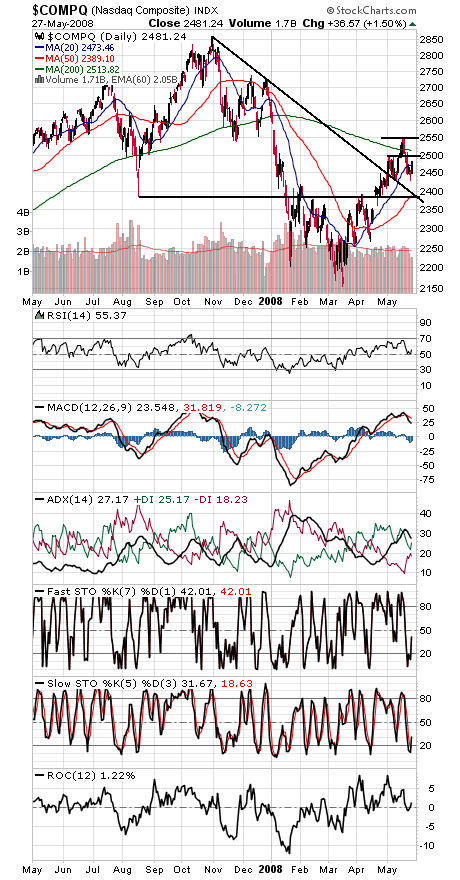
The Nasdaq (second chart) is a long way from similar support at 2390. First support levels are 2456 and 2430, and resistance is 2500, 2514 and 2550.
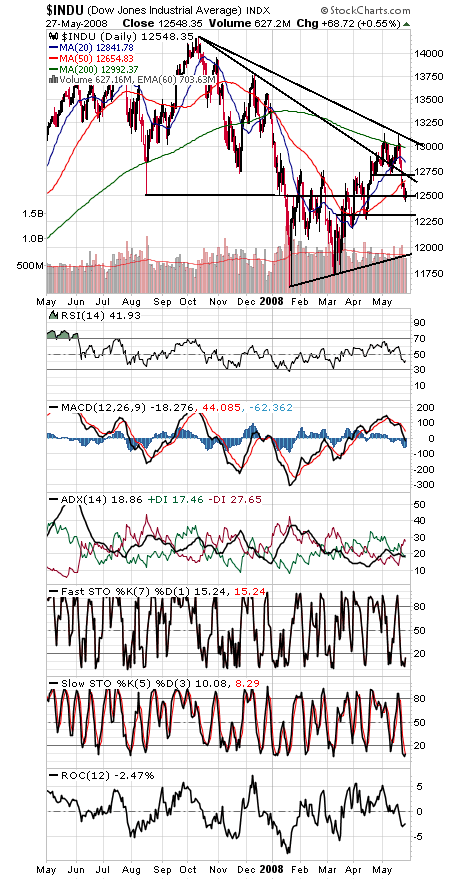
The Dow (third chart) remains the laggard here. If it can’t hold 12,500, 12,303 could be next. Resistance for the blue chips is 12,654-12,743.
Paul Shread is a Chartered Market Technician (CMT) and member of the Market Technicians Association.