Technical Analysis: Mid-Term Test | Internet News

Technical Analysis: Mid-Term Test

Written By
Paul Shread
Paul Shread
Jul 12, 2008
1 minute read

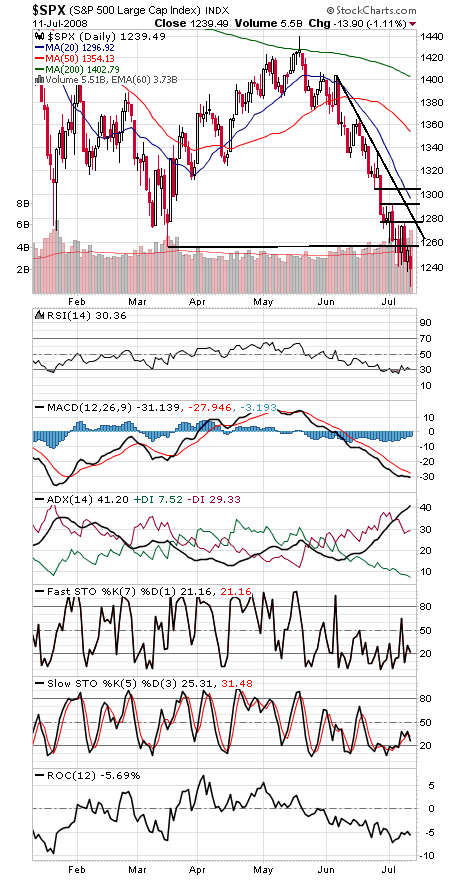
The S&P (first chart below) got as low as 1225 today, just above its mid-term election year low of 1219 from 2006. Mid-term lows have held for at least a few years since 1934, so some kind of bounce seems likely soon. If there’s any good news on the financial front, it could be a good one.

To the upside, 1257 is first resistance for the S&P, with 1277, 1292 and 1304 above that.

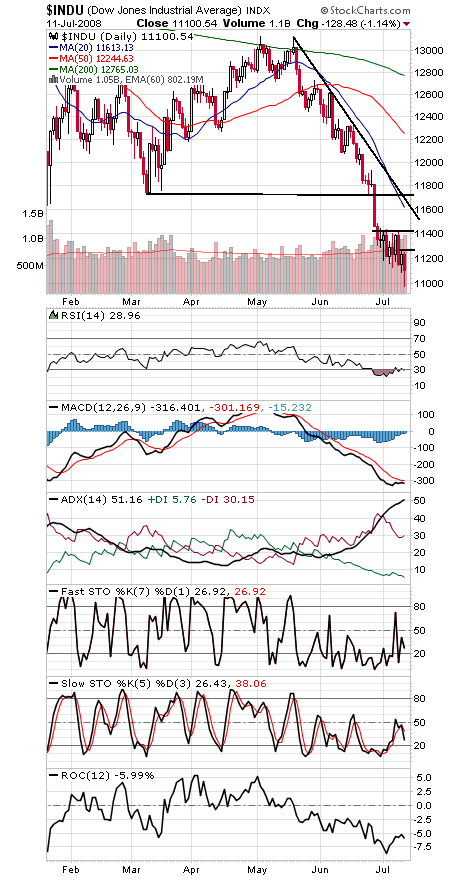
The same support level on the Dow (second chart) is at 10,683-10,739; the index got as low as 10,977 today. To the upside, the Dow needs to clear 11,270, 11,434-11,485 and 11,634-11,750.

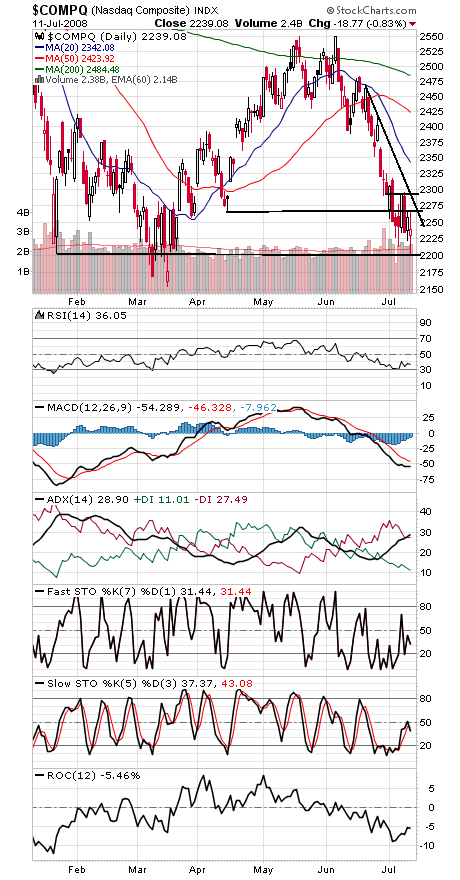
The Nasdaq (third chart) found support just above 2200 today, with 2155 the next level below that. To the upside, 2267, 2280 and 2294 are resistance.

Paul Shread is a Chartered Market Technician (CMT) and member of the Market Technicians Association.

Internet News Logo

InternetNews is a source of industry news and intelligence for IT professionals from all branches of the technology world. InternetNews focuses on helping professionals grow their knowledge base and authority in their field with the top news and trends in Software, IT Management, Networking & Communications, and Small Business.

Property of TechnologyAdvice. © 2026 TechnologyAdvice. All Rights Reserved

Advertiser Disclosure: Some of the products that appear on this site are from companies from which TechnologyAdvice receives compensation. This compensation may impact how and where products appear on this site including, for example, the order in which they appear. TechnologyAdvice does not include all companies or all types of products available in the marketplace.