Some mixed signals in the market today.
We’ll start with the most positive: a DeMark sequential buy signal on the S&P 500. Here’s hoping this one works as well as the one in July that marked the exact bottom in the Dow.
But we’ll need some sign that momentum has turned back up to confirm a bottom. Today was a 90% downside volume day on the NYSE, suggesting that momentum has turned back down — unless we can get a 90% upside day in the next week or so for an all-clear signal.
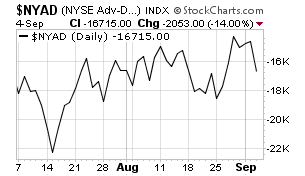
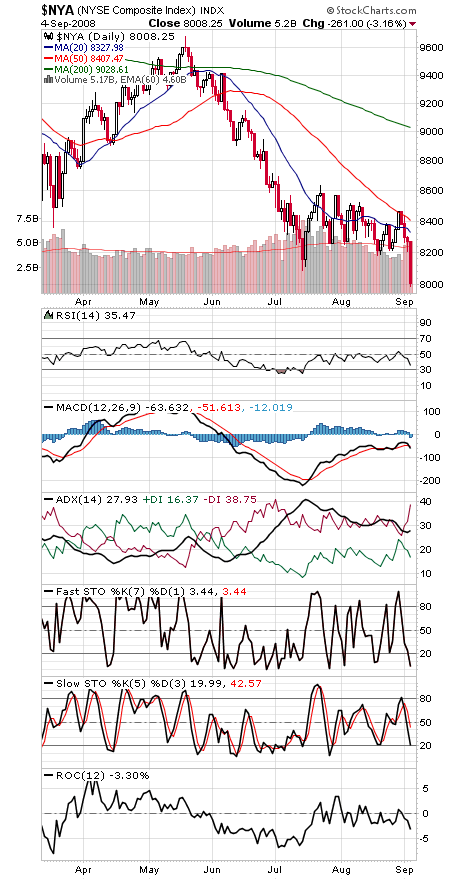
The NYSE advance-decline line (first chart below) has been outperforming even as the NYSE itself (second chart) hit a new low, which suggests that more stocks are finding support here, an eventual positive for the market as a whole. Perhaps the best-case scenario would be a retest of the Dow and S&P lows with a higher low in the A-D line.
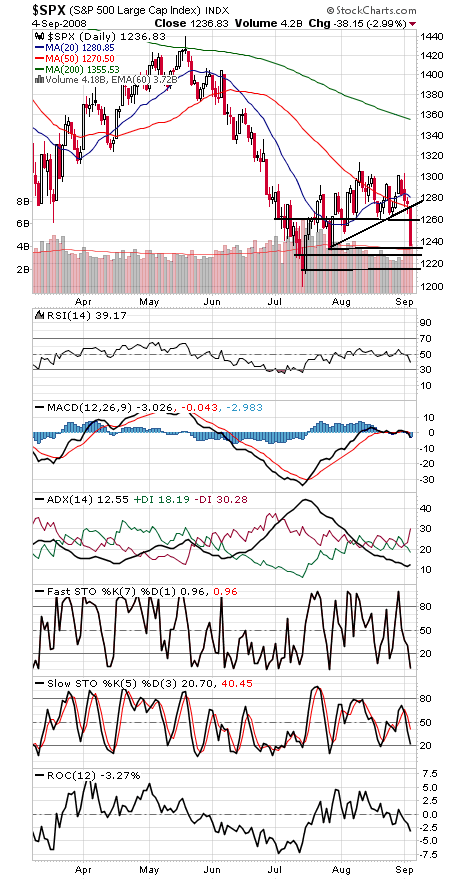
The S&P (third chart) lost a whole lot of support at 1270 today and kept going; 1260 and 1270 are now first resistance for the bulls. The next support levels are 1234, 1215 and 1200, with 1155-1163 possible if that can’t hold — a level that marked the early 2004 top.
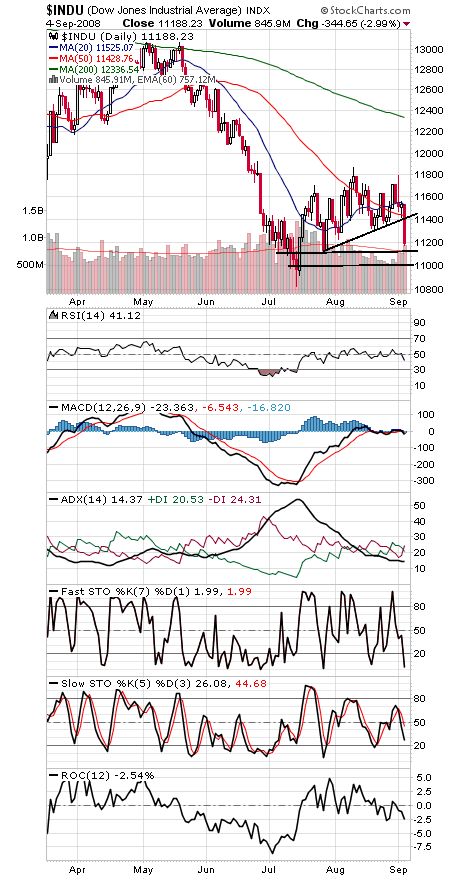
The Dow (fourth chart) faces upside resistance at 11,300 and 11,430, and the next support levels are 11,125, 11,000 and 10,670-10,827.
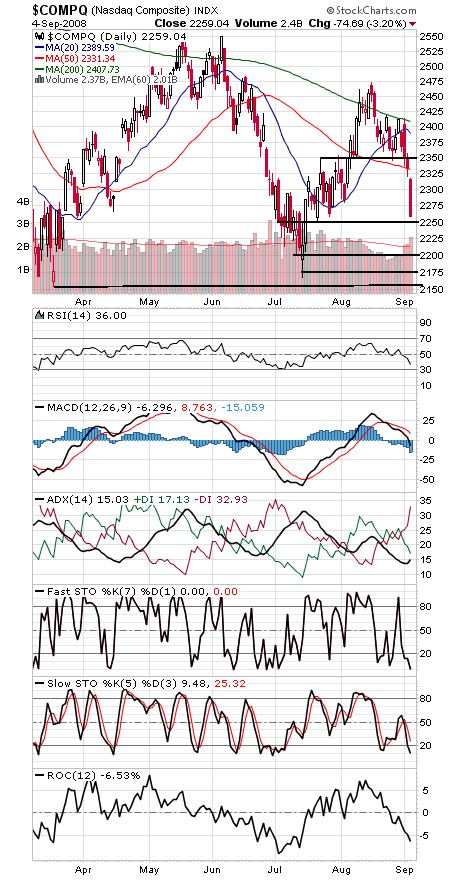
The Nasdaq (fifth chart) is another index accelerating to the downside. Resistance is now 2330-2350, and support is 2250, 2200 and 2150-2175.
Paul Shread is a Chartered Market Technician (CMT) and member of the Market Technicians Association.