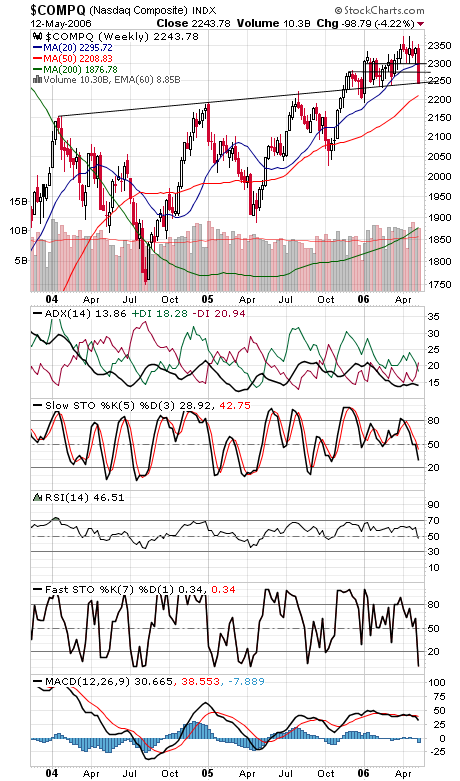
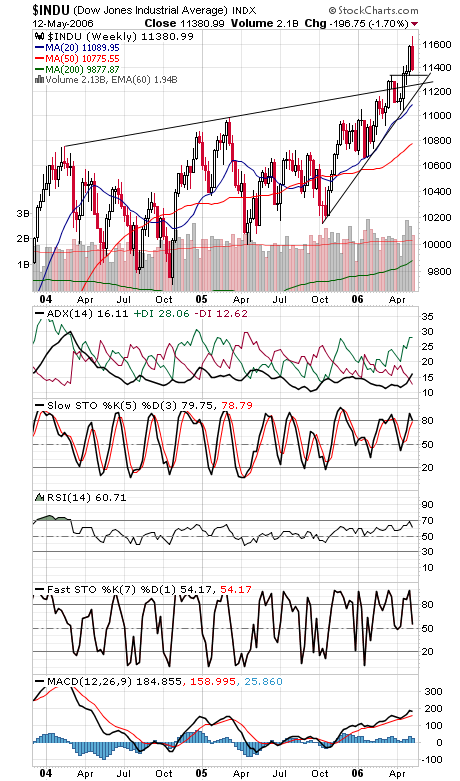
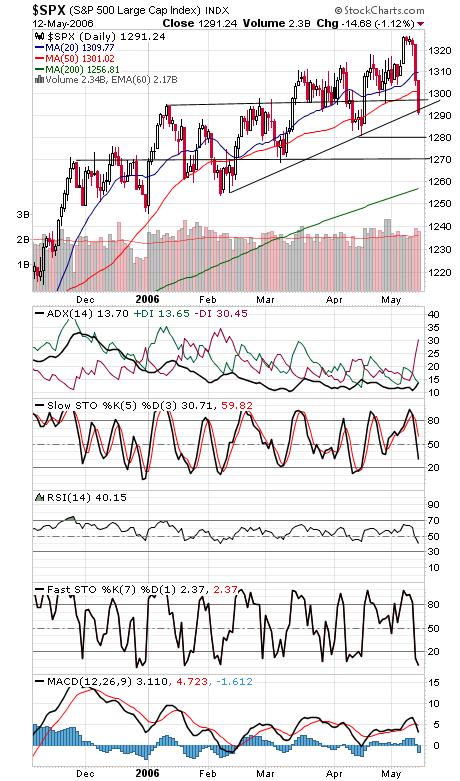
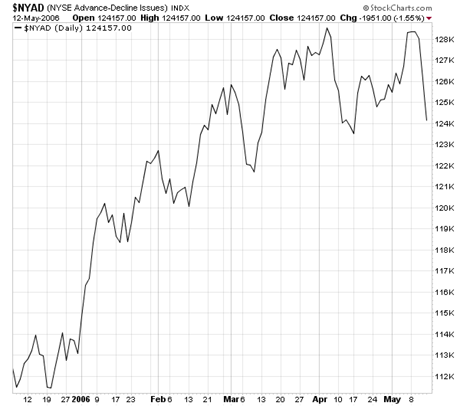
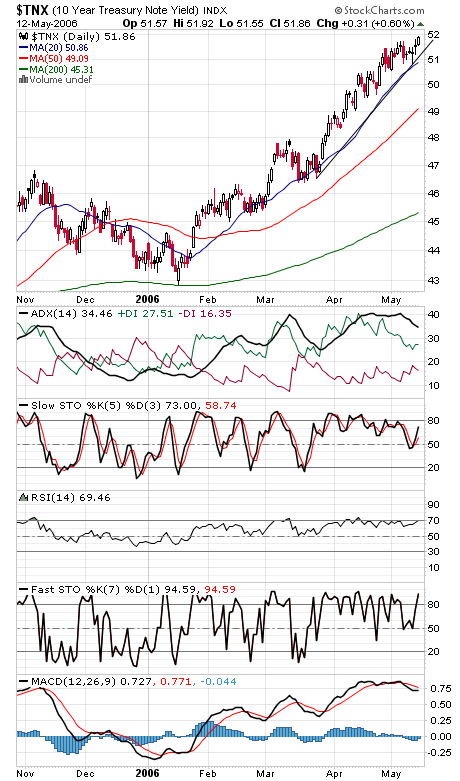
The Nasdaq (first chart below) ended the week right at the critical support level of 2240-2245, although the index could go as low as 2232 and stay generally within that old consolidation. Due to the index’s freefall this week, 2300 looks like the first major resistance level, although 2275 would be a good start. For the Dow (second chart), 11,350, 11,260 and 11,200 are important support, and resistance is 11,426, 11,500, 11,600 and 11,722-11,750. The S&P (third chart) has support at 1280-1282 and 1268-1275, and resistance is 1293, 1296 and 1300-1303. We won’t bother you with the NYSE advance-decline line (fourth chart) again for a while; suffice it to say, the negative divergence we’ve been pointing out was significant. Long bond yields (fifth chart) are heading the wrong way out of their recent consolidation.
