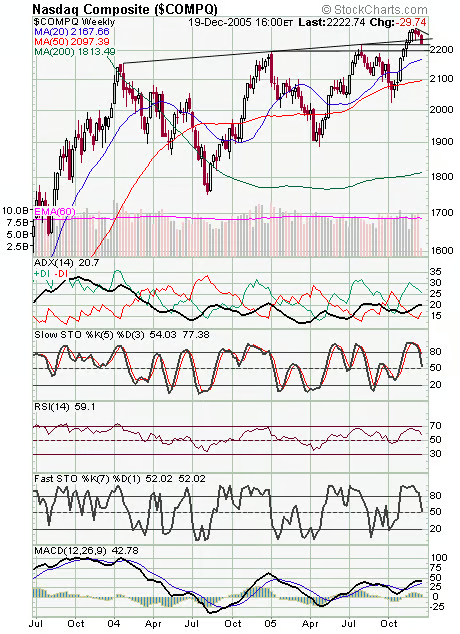
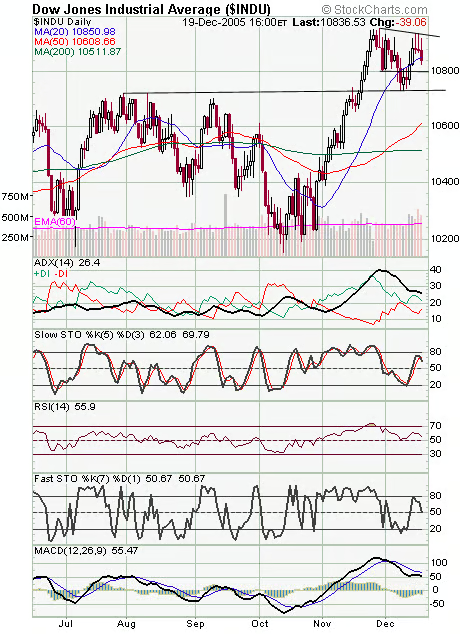
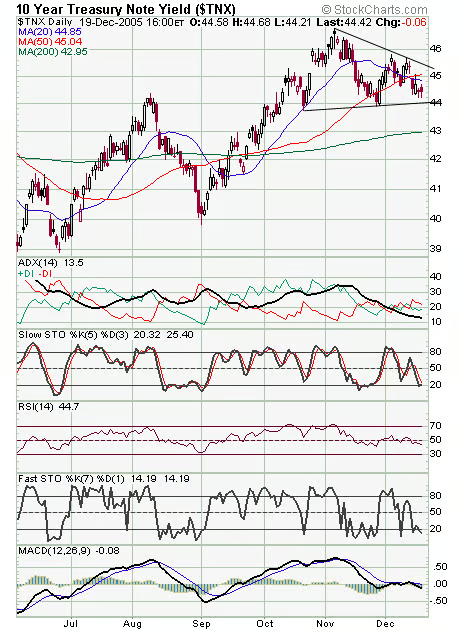
The Nasdaq (first chart below) fell back below the two-year trendline that had capped rallies until last month — a big disappointment for the techs. That makes 2235-2240 major resistance again, and support is 2220 and 2200. The S&P and Dow (second and third charts) are the problem for the market here: the S&P must clear its multi-month resistance line at 1277-1282, and the Dow must clear that stubborn 10,950-11,000 resistance zone. The S&P has support at 1259 and 1246-1250, and the Dow has support at 10,800-10,820 and 10,720-10,750. Long bonds (fourth chart) remain stuck in neutral, but at least the trend since November has been lower for yields.