Technical Analysis: Nasdaq Hits Headwinds | Internet News

Technical Analysis: Nasdaq Hits Headwinds

Written By
Paul Shread
Paul Shread
Mar 14, 2006
1 minute read


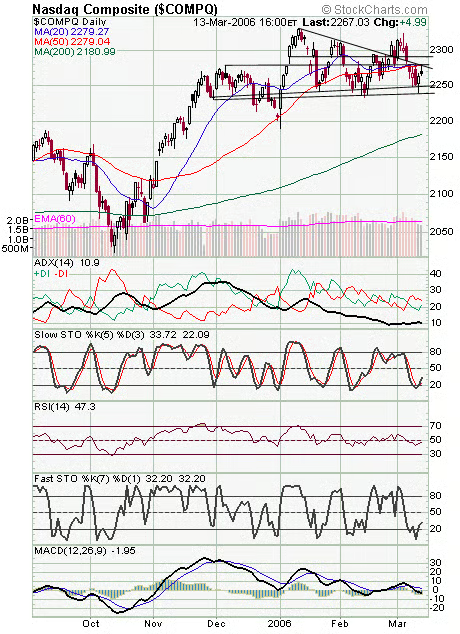
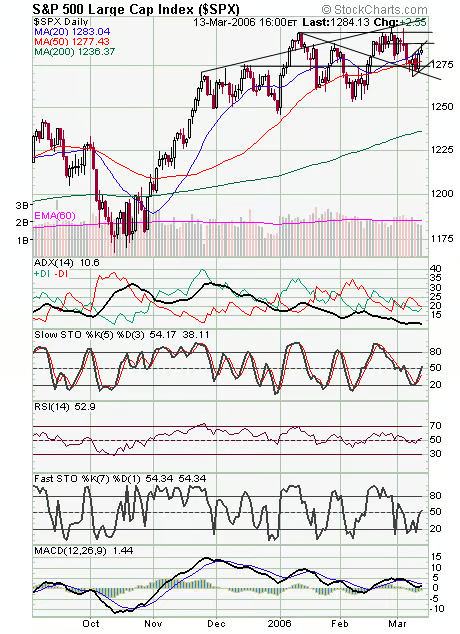
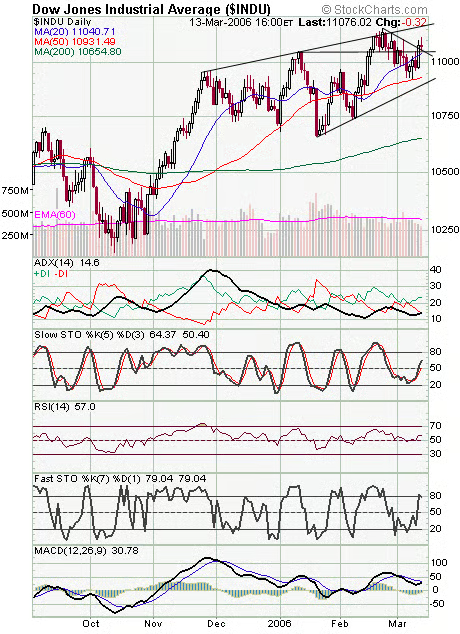
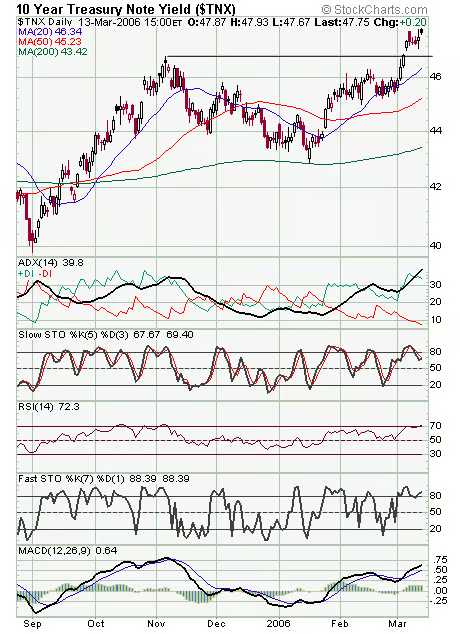
The Nasdaq (first chart below) ran into a bunch of resistance at 2280 today. If the index can get above that, 2290-2300 will be the next target. Critical support remains at 2240-2250. The S&P (second chart) stalled in the middle of a big consolidation at 1287-1288, with 1295 the next big level above that. Support is 1280-1281, 1278, 1275 and 1270. The Dow (third chart) held 11,050 support nicely today, but what looked like a bearish broadening pattern now looks like a bearish rising wedge. Long bond yields (fourth chart) remain quite extended here, but no break yet for the bulls.


Internet News Logo

InternetNews is a source of industry news and intelligence for IT professionals from all branches of the technology world. InternetNews focuses on helping professionals grow their knowledge base and authority in their field with the top news and trends in Software, IT Management, Networking & Communications, and Small Business.

Property of TechnologyAdvice. © 2026 TechnologyAdvice. All Rights Reserved

Advertiser Disclosure: Some of the products that appear on this site are from companies from which TechnologyAdvice receives compensation. This compensation may impact how and where products appear on this site including, for example, the order in which they appear. TechnologyAdvice does not include all companies or all types of products available in the marketplace.