Technical Analysis: Nasdaq Hits Resistance | Internet News

Technical Analysis: Nasdaq Hits Resistance

Written By
Paul Shread
Paul Shread
Nov 19, 2005
1 minute read


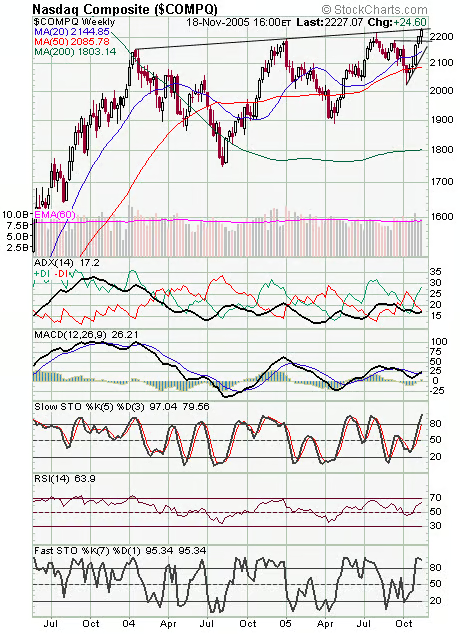
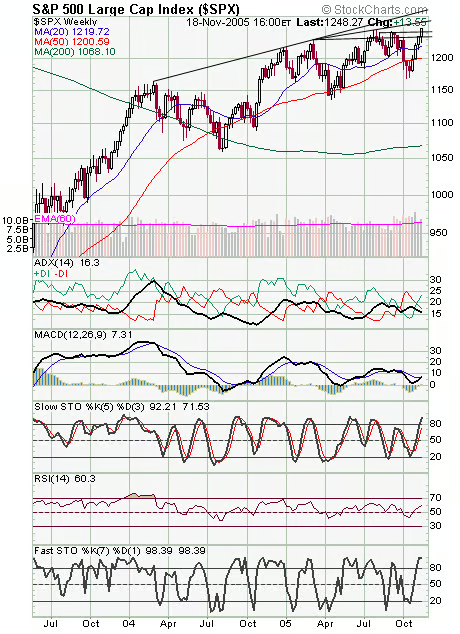
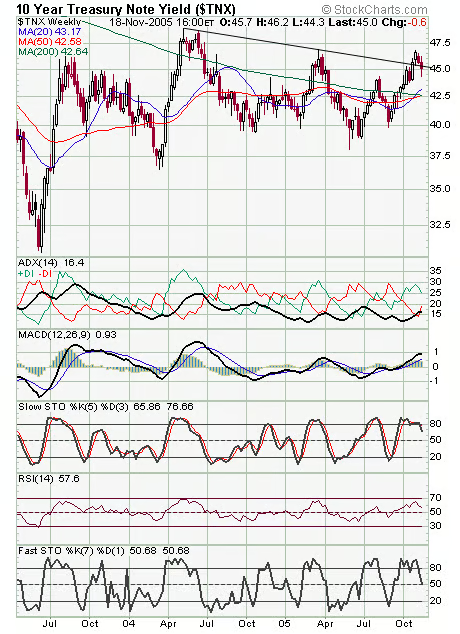
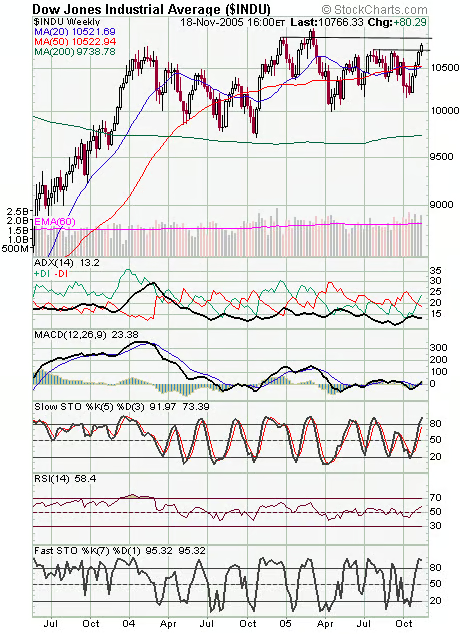
The Nasdaq (first chart below) made a valiant effort, but it was once again stopped at a resistance line that has capped rallies for the last two years. If techs are going to correct, this looks like a possible spot. Resistance is 2234 and 2252, and support is 2220 and 2200-2207. The S&P (second chart) faces major resistance at between 1250 and 1260, and then again at 1275. Support is 1239-1240, 1235 and 1229-1233. Bonds (third chart), meanwhile, still look a little shaky here. We’re still waiting for a sustained advance there. The Dow (fourth chart) faces resistance at 10,800 and 10,868, and support is 10,720, 10,650-10,670 and 10,600-10,620.


Internet News Logo

InternetNews is a source of industry news and intelligence for IT professionals from all branches of the technology world. InternetNews focuses on helping professionals grow their knowledge base and authority in their field with the top news and trends in Software, IT Management, Networking & Communications, and Small Business.

Property of TechnologyAdvice. © 2026 TechnologyAdvice. All Rights Reserved

Advertiser Disclosure: Some of the products that appear on this site are from companies from which TechnologyAdvice receives compensation. This compensation may impact how and where products appear on this site including, for example, the order in which they appear. TechnologyAdvice does not include all companies or all types of products available in the marketplace.