Technical Analysis: Nasdaq Nears Major Support | Internet News

Technical Analysis: Nasdaq Nears Major Support

Written By
Paul Shread
Paul Shread
May 12, 2006
1 minute read


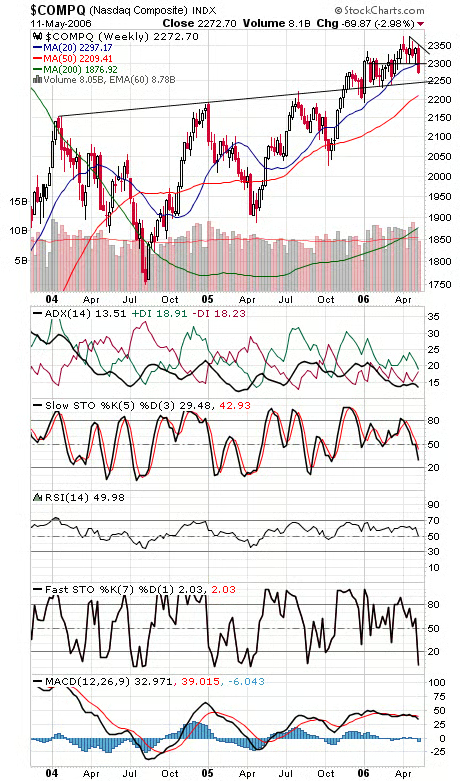
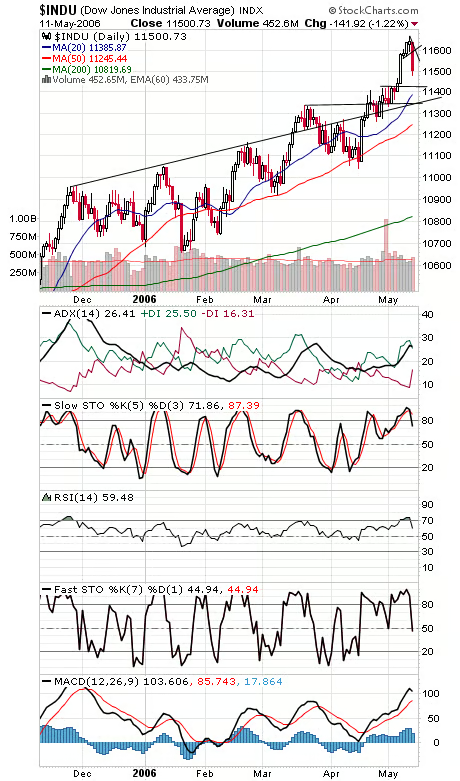
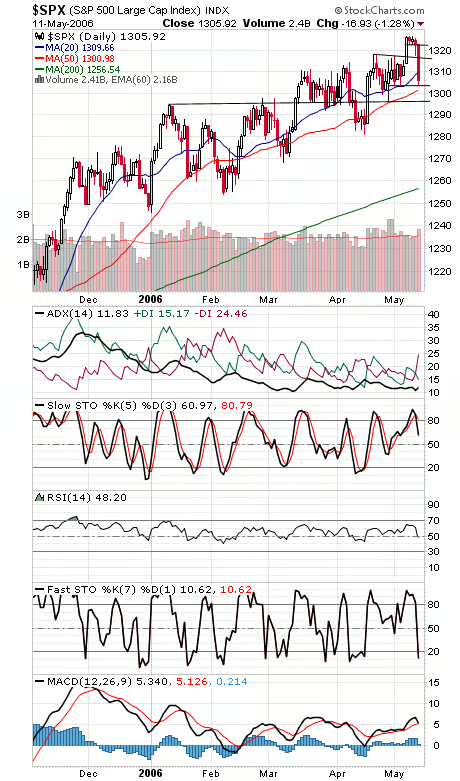
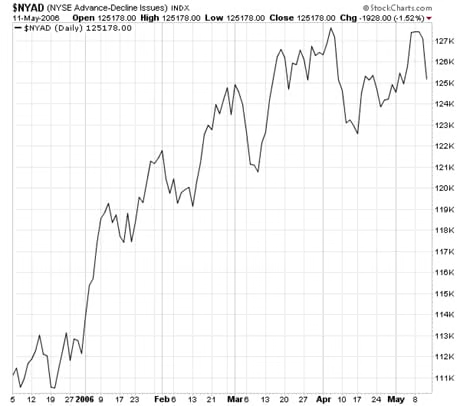
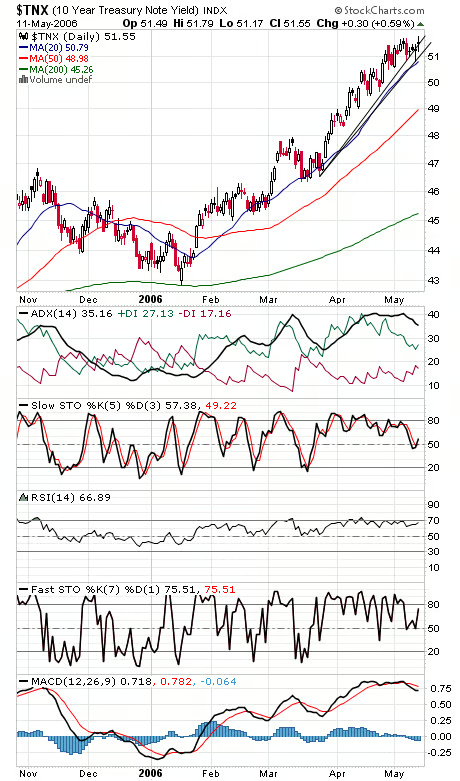
The biggest question about today is whether the heavy selling marks a short-term reaction to the Fed or the start of a bigger correction. We’re going to watch the Nasdaq (first chart below) for clues on that one. 2240-2245 is critical support on the Nasdaq, and 2300 looks like important resistance on the weekly chart. For the Dow (second chart), 11,350-11,426 is important support, and resistance is 11,600 and the index’s all-time high of 11,722-11,750. The S&P (third chart) has support at 1300-1303 and 1295-1296, and resistance is 1316, 1322 and 1327. The NYSE advance-decline line (fourth chart) remains a problem for the market, failing to follow the Dow, S&P and NYSE to new recovery highs. Rising long bond yields (fifth chart) finally caught up to the stock market, but they don’t seem to be going anywhere in a hurry here.


Internet News Logo

InternetNews is a source of industry news and intelligence for IT professionals from all branches of the technology world. InternetNews focuses on helping professionals grow their knowledge base and authority in their field with the top news and trends in Software, IT Management, Networking & Communications, and Small Business.

Property of TechnologyAdvice. © 2026 TechnologyAdvice. All Rights Reserved

Advertiser Disclosure: Some of the products that appear on this site are from companies from which TechnologyAdvice receives compensation. This compensation may impact how and where products appear on this site including, for example, the order in which they appear. TechnologyAdvice does not include all companies or all types of products available in the marketplace.