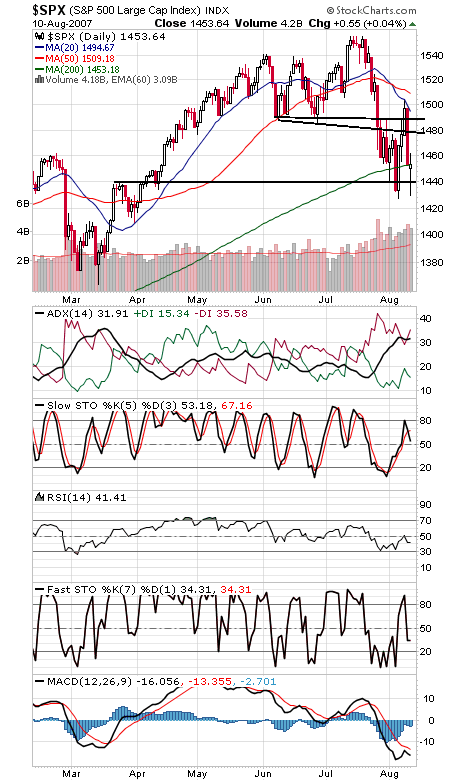
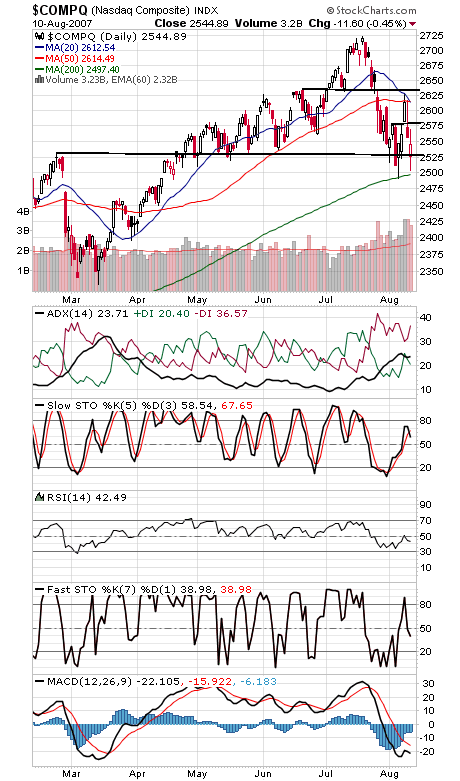
Stocks finally found a little stability today, and with the S&P and Nasdaq holding their recent lows, perhaps we’re witnessing nothing more than a retest. But now we need some confirmation of a bottom in the form of a 90% upside volume day, proof that sellers have indeed been exhausted. Until we get that — and with stocks in the weakest months of the year — volatility will likely be the norm. One modest negative data point today: Big S&P futures traders reduced their long positions this week, but at least they remain net long. In general, sentiment remains positive, even if seasonality doesn’t.
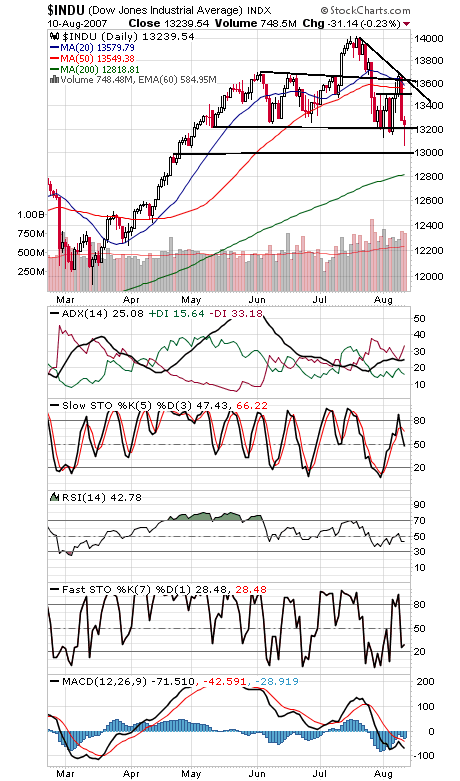
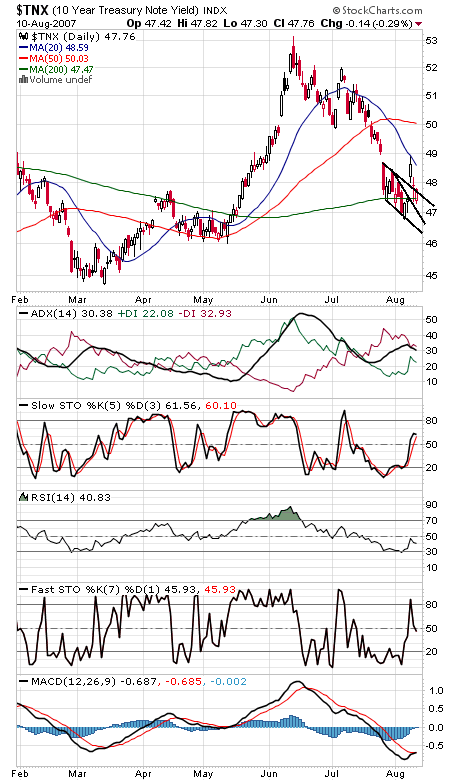
The S&P (first chart below) closed just above its 50-day average today. 1461, 1480, 1488 and 1504 are resistance, and support is 1440 and 1427-1429. 2500 is critical support for the Nasdaq (second chart), and resistance is 2570-2580, 2607-2615 and 2631. The Dow (third chart) has support at 13,200 and 13,000, and resistance remains 13,500-13,520, 13,550, 13,630 and 13,700. The 10-year yield (fourth chart) is barely clinging to its recent upside breakout.
Paul Shread is a Chartered Market Technician (CMT) and member of the Market Technicians Association


