Technical Analysis: No Break for Bulls | Internet News

Technical Analysis: No Break for Bulls

Written By
Paul Shread
Paul Shread
Jun 8, 2006
1 minute read


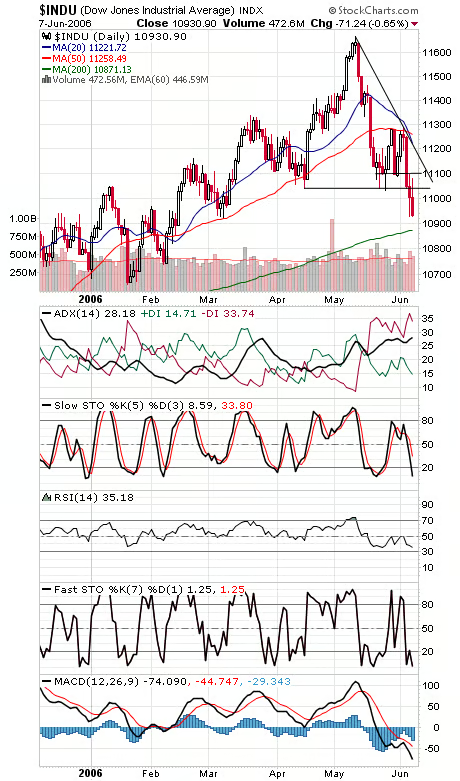
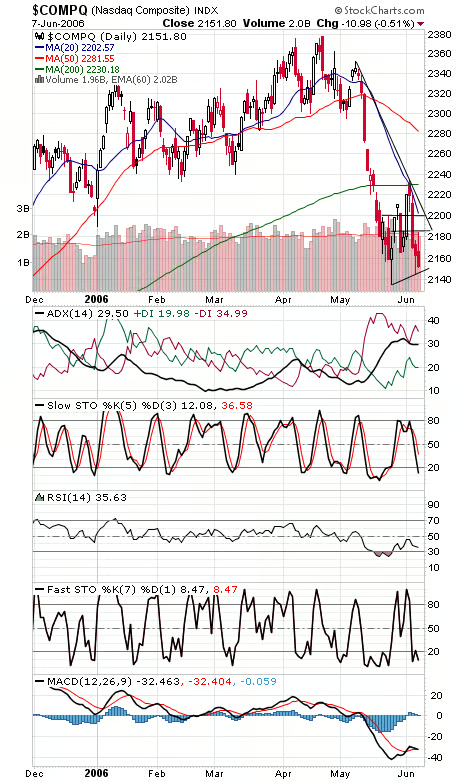
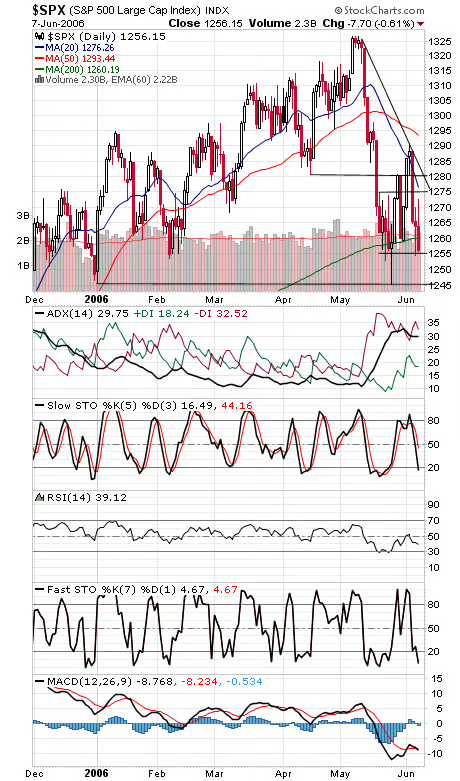
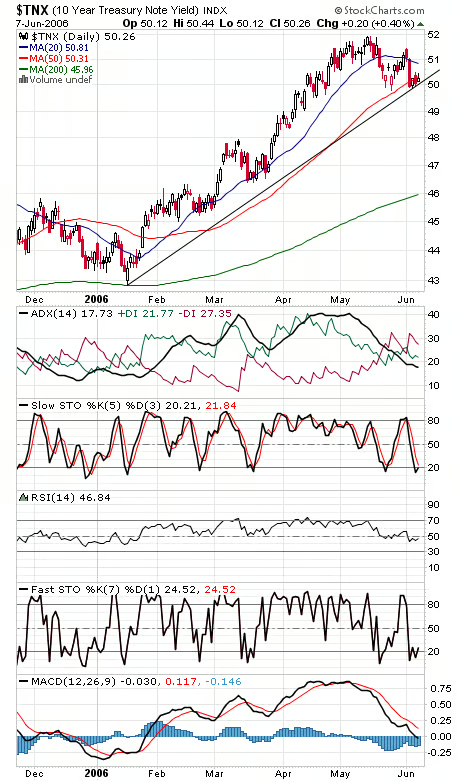
About the only positive we can find here is that the Nasdaq and S&P aren’t following the Dow to new lows, at least not yet. The Dow (first chart below) made a nice attempt to recover from yesterday’s breakdown before turning back down today. 11,030-11,040 and 11,077-11,100 are resistance, and support is 10,925 and 10,872. The Nasdaq (second chart) has support at 2144 and 2125-2135, and resistance is 2185 and 2200. The S&P (third chart) has support at 1254 and 1245-1250, and resistance is 1261, 1270, 1275 and 1281. No break from long bond yields (fourth chart) today, but they sure look set up to head lower in the near term.


Internet News Logo

InternetNews is a source of industry news and intelligence for IT professionals from all branches of the technology world. InternetNews focuses on helping professionals grow their knowledge base and authority in their field with the top news and trends in Software, IT Management, Networking & Communications, and Small Business.

Property of TechnologyAdvice. © 2026 TechnologyAdvice. All Rights Reserved

Advertiser Disclosure: Some of the products that appear on this site are from companies from which TechnologyAdvice receives compensation. This compensation may impact how and where products appear on this site including, for example, the order in which they appear. TechnologyAdvice does not include all companies or all types of products available in the marketplace.