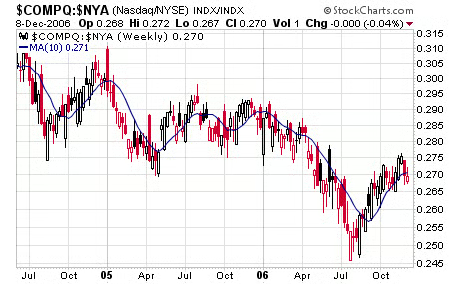
The Nasdaq made a valiant effort, but still registered a sell signal under Gerald Appel’s Nasdaq-NYSE relative strength indicator (first chart below). There were a couple of troubling aspects to today’s action. First, the indicator acted as resistance instead of support as the day wore on, the opposite of the pattern we’ve seen recently. And second, the jobs report was a very market-friendly number, yet stocks did not respond enthusiastically; that’s another warning sign. All this could be reversed with a strong opening on Monday, but for now, we’ve had a few too many warnings signs in the market this week. Oddly, Nasdaq futures positions are pretty solid, with commercials long the big contract and the nonreportables short, although the S&P has seen plenty of shorting. Again, the market doesn’t necessarily have to decline here, and the charts overall still look pretty solid, but the risk for tech investors in particular has risen. We should also note that not every signal will work as well as the Nasdaq’s September buy signal, but this one sure turned out to be a beauty: an 11% gain in three months. Add 2% for sitting in cash, and the system beat the Nasdaq by 3% so far this year with 75% less exposure.
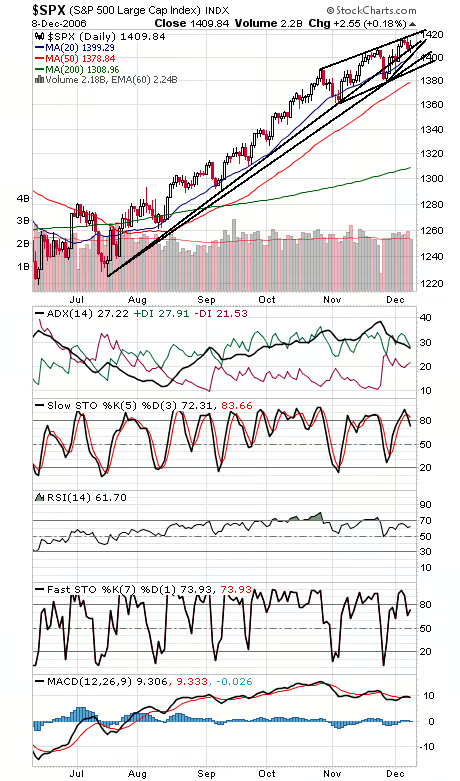
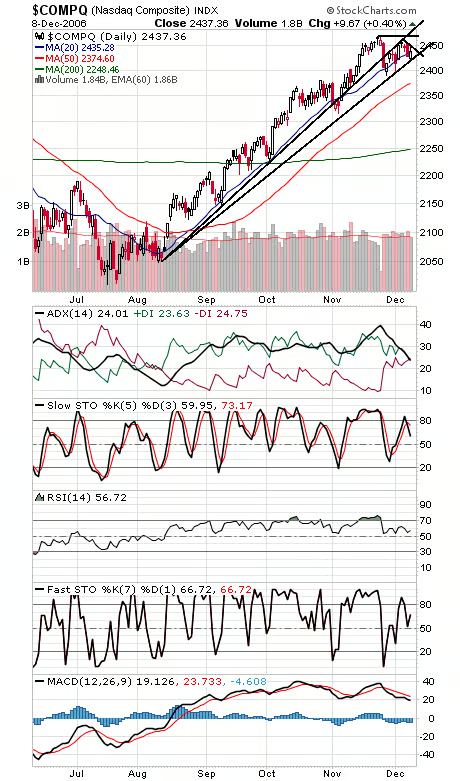
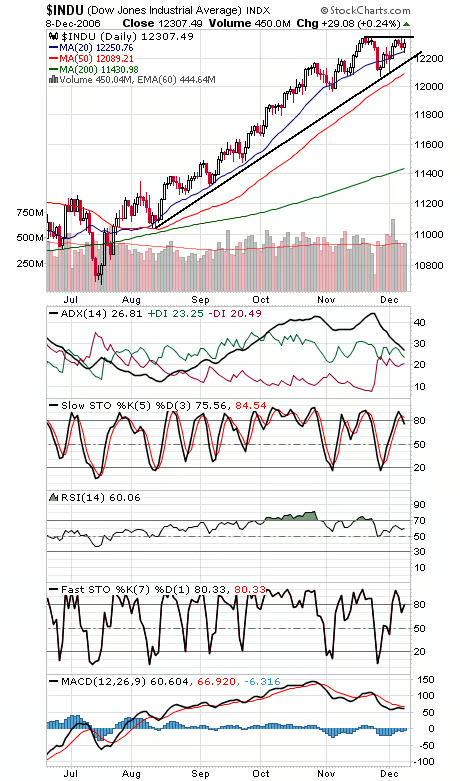
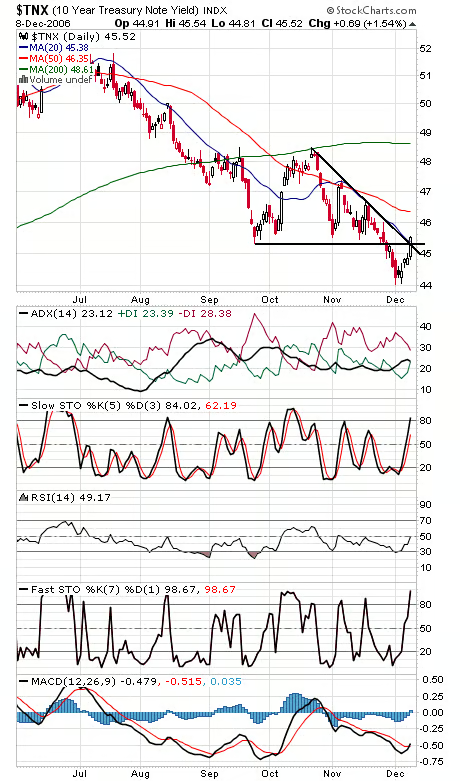
The S&P (second chart) looks pretty good, holding its main uptrend line on a weekly close. 1414 and 1420 are the levels to beat to the upside, and support is 1403-1404, 1400, 1394 and 1390. The Nasdaq (third chart) is trying to establish a new uptrend line. Support is 2425, and resistance is 2445, 2450, 2455 and 2468. The Dow (fourth chart) faces resistance at 12,355-12,361, and support is 12,260 and 12,190. The bond market (fifth chart) sustained some significant technical damage today.