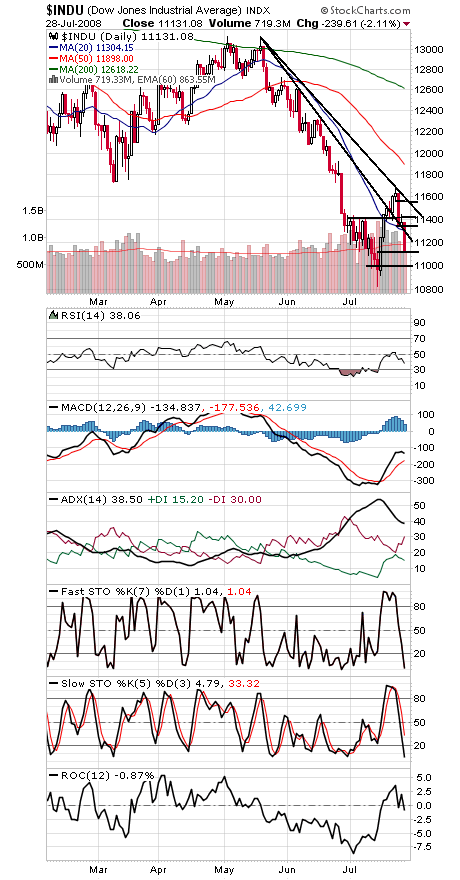
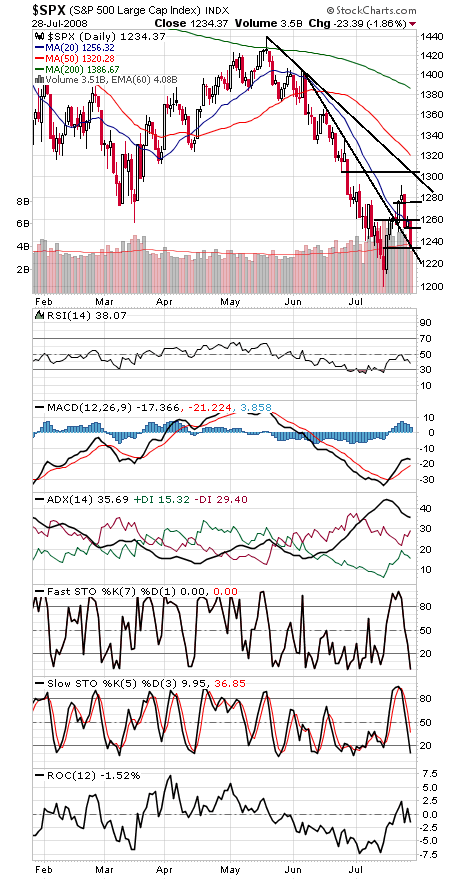
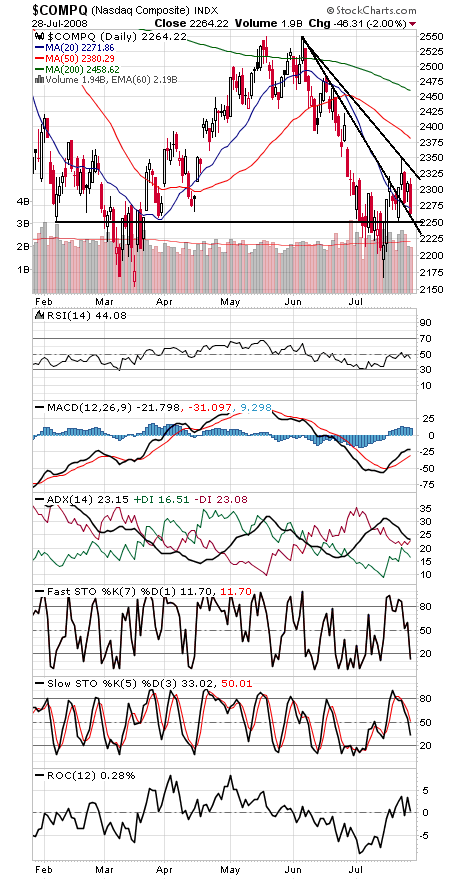
Stocks are once again as oversold as they were at the January and March bottoms and again two weeks ago. Can they put together a bounce that will be any more lasting than the last few times? Only if we can see some forceful upside buying that would suggest sellers are finally sold out enough for a lasting low.
So far this pullback has gone deeper than we would prefer, touching the critical support levels of 11,123 on the Dow and 1234 on the S&P (first two charts below). Much lower and we could see a complete retest of the lows earlier this month at 10,827 and 1200.
To the upside, the Dow needs to get back above 11,230, 11,350, 11,400 and 11,560 — before hitting the biggest test at 11,731-11,750.
The S&P faces resistance at 1240, 1250, 1257, 1276, 1292 and 1304.
The Nasdaq (third chart) is outperforming here, but what kind of fun is it outperforming in a down market? 2250 is a big support level, with 2200 possible below that, and resistance is 2279-2282, 2300, 2320, 2330 and 2350.
Paul Shread is a Chartered Market Technician (CMT) and member of the Market Technicians Association.


